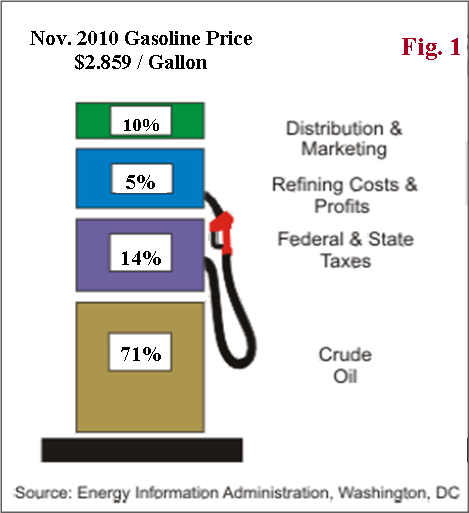
Gasoline On A Roll To The Upside….Here Is A Breakdown Of What Goes Into Each Gallon Of Gas At The Pump
Posted By thestatedtruth.com on December 26, 2010
U.S. gasoline prices hit an average $3 a gallon for the first time in more than two years, according to AAA’s Daily Fuel Gauge Report.
Crude oil is the biggest component, and accounts for about 71% of the price of gasoline as of Nov. 2010, based on EIA estimate (Fig. 1).  Roughly, for every one dollar increase in the per barrel (42 gallons) price of oil, gasoline prices rise 2.5 cents per gallon. So, a ten-dollar rise in crude price per barrel would add about 25 cents at the pump.Â
- The week-on-week crude inventory draw was largely due to refiners’ year-end strategy to minimize potential taxes on year-end inventory.Â
- Despite a weekly draw, crude oil, along with products inventories (except distillate), all saw a year-over-year increase (Fig. 2). Crude inventory level is still above the average range (Fig. 2), while gasoline inventory is also close to the high end of the average range.Â
- If there’s strong demand elsewhere around the globe, as many have suggested, there should not be such a build in the domestic inventory.
- The global physical oil market also tells a similar story. WSJ reported that the International Energy Agency (IEA) estimates OPEC spare capacity is around 6.4% of global demand, nearly double the level of late 2007. Data from Oil Market Intelligence also indicate the world oil inventories stood at 20 days worth of demand, up from 14 days in November 2007.
More at: http://www.businessinsider.com/crude-oil-speculators-2010-12


Comments