Just In: The Latest Housing Data From CoreLogic
Posted By thestatedtruth.com on March 1, 2012
Housing Tid Bits…..
The latest quarterly report out of CoreLogic is full of insights about the state of U.S. housing. Key among them is that “negative equity and near-negative equity mortgages accounted for 27.8 percent of all residential properties with a mortgage nationwide in the fourth quarter, up from 27.1 in the previous quarter.
Nationally, the total mortgage debt outstanding on properties in negative equity increased from $2.7 trillion in the third quarter to $2.8 trillion in the fourth quarter.” The facts are that there is at least $2.8 trillion in debt held by investors (read banks and GSEs) that is marked at par and actually should be impaired. And one wonders why Fannie lost $16.9 billion in 2011. Duh.
Among Other findings:
- Nevada had the highest negative equity percentage with 61 percent of all of its mortgaged properties underwater, followed by Arizona (48 percent), Florida (44 percent), Michigan (35 percent) and Georgia (33 percent). This is the second consecutive quarter that Georgia was in the top five, surpassing California (30 percent) which previously had been in the top five since tracking began in 2009. The top five states combined have an average negative equity share of 44.3 percent, while the remaining states have a combined average negative equity share of 15.3 percent.
- Of the 11.1 million upside-down borrowers, there are 6.7 million first liens without home equity loans. This group of borrowers has an average mortgage balance of$219,000 and is underwater by an average of $51,000 or an LTV ratio of 130 percent. For all first-lien-only borrowers negative equity share was 18 percent, while 41 percent of all first-lien-only borrowers had 80 percent LTV or higher.
- The remaining 4.4 million upside-down borrowers had both first and second liens. Their average mortgage balance was $306,000 and they were upside down by anaverage of $84,000 or a combined LTV of 138 percent. The negative equity share for all first-lien borrowers with home equity loans was 39 percent, more than twice the share for all first-lien-only borrowers. Over 60 percent of borrowers with first liens and home equity loans had combined LTVs of 80 percent or higher.
- Nearly 18 million borrowers were between 80 percent and 125 percent LTV and, purely from an LTV perspective, eligible for HARP 1.0. The removal of the 125 percent LTV cap via HARP 2.0 means that over 22 million borrowers are currently eligible for HARP 2.0 when just considering LTV alone.
- The low end of the market is where the bulk of the negative equity is concentrated. For example, for low-to-mid value homes valued at less than $200,000, the negative equity share is 54 percent for borrowers with home equity loans, over twice the 26 percent for borrowers without home equity loans.
- Of the total $717 billion in aggregate negative equity, first liens without home equity loans accounted for $342 billion aggregate negative equity, while first liens with home equity loans accounted for $375 billion. Over $230 billion in negative equity is from homes valued at $200,000 or less.
- There were 8.8 million negative-equity conventional loans with an average balance of $269,000 that are underwater by an average of $70,000. There were 1.7 million underwater FHA loans with an average balance of $169,000 that are underwater by an average of $26,000.
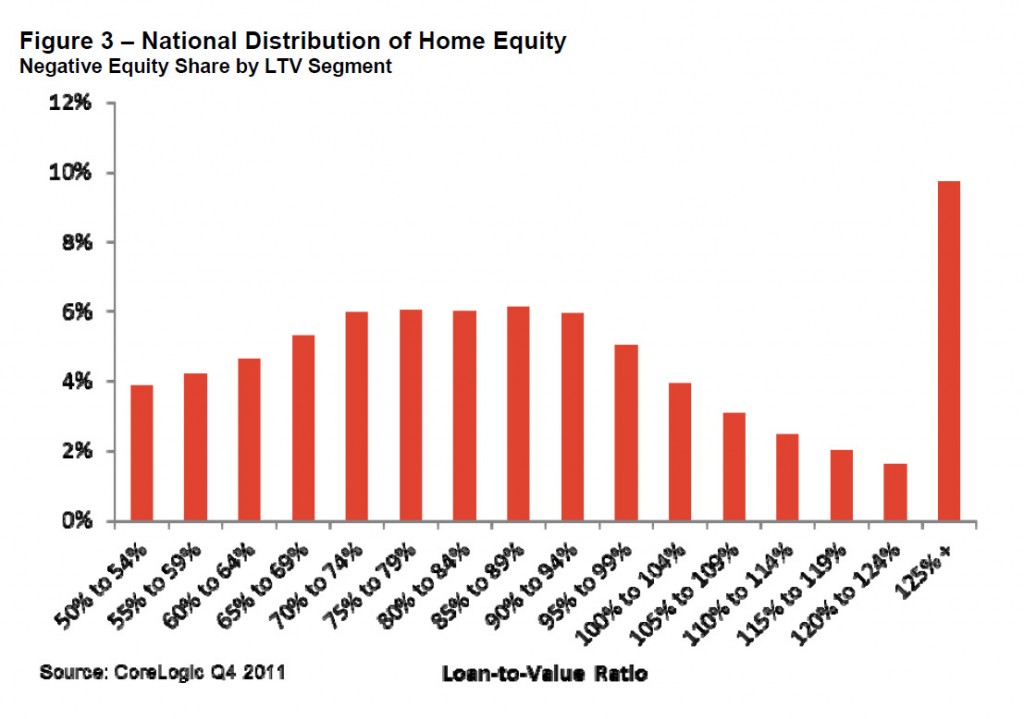
Here is what the LTV histogram of U.S. housing looks like:
More in the full report.
Comments
3 Responses to “Just In: The Latest Housing Data From CoreLogic”
Leave a Reply
You must be logged in to post a comment.


free china classified ads
No free advertisings,no kiss
free software download
download free software,software free,full version software Free,download free of charge,free laptop or computer game download,free android software,apk game titles,all softwares
download free pc games action
Download Full Version Free Software