The “Baby Boom” Generation, It Came And Now It’s Going
Posted By thestatedtruth.com on February 15, 2010
The “Baby Boom” generation consists of people born from 1946-64, which is that big bulge in the birth rate near the center of the chart. When the 1980s arrived, those boomers were in their prime working years, and helped to push up both economic growth and stock prices. They also caused the birth rate to peak again in 1990.Â
The chart below shows that bulge in the population in another way, as measured in the 2000 Census. The bars show how many people there were in the US in each age group.
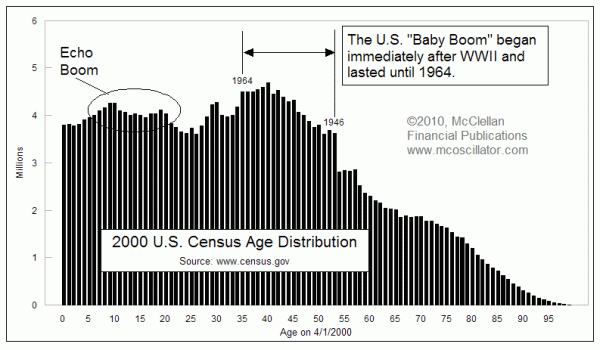
The reason why this age demographic profile is important now is because the boomer generation is now starting to retire. So their population bulge is transitioning from the production/saving age group into the non-producing portion of the population. Along the way, those boomers are going to want to sell their big houses and their investment portfolios to the younger people, and there are not as many of the younger people. For the sellers of assets to compete for the attentions of the smaller number of buyers, the sellers are going to have to accept lower prices.Â
That imbalance of sellers to buyers is going to have a depressing effect on investment asset prices for a long time. Starting in the 2020s, when the “echo boomers” hit their productive years, things should start getting better again, but until then the combination of boomers retiring and echo-boomers still being young and in school will keep people out of the “producers” portion of the population.Â
And that likely means we are in for a sideways market during the 2010s, much like what we saw in the 1970s and 1930s.
Tom McClellan

Comments