U.S. TREASURY AUCTION – Historic Direct Versus Indirect Bids

Posted By on April 18, 2010

U.S. TREASURY AUCTION – Historic Direct Versus Indirect Bids

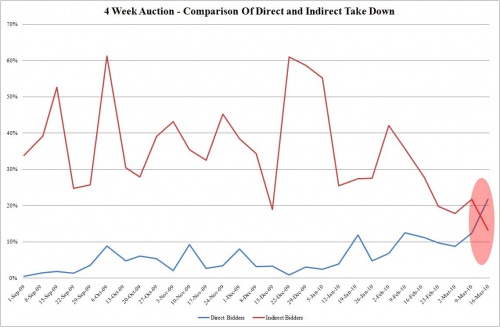
With a historic and massive $1.6 Trillion of new US government debt to be financed in 2010, as tax payers on the hook for this debt, we need to listen to what is concerning those that participate in the critically important US Treasury Auction. Additionally, we need to remember besides new debt we also have roll-over of existing debt. The rollover debt is also huge because of government policy to shorten maturity duration over the last few years. This policy was meant to keep debt payments down by taking advantage of lower shorter term rates. The US Treasury on our behalf, accepted the risk and gambled against interest rates increasing. This was one way our elected officials hid the actual size of growing fiscal imbalances from ‘we, the tax payer’.  What we presently find in the Treasury Auction is the professionals scratching their head and wanting to know who the mysterious Direct Bidder is.


Bonds 1


Bonds 2 

For those who don’t understand the world of Treasury Auctions, let me simplistically say there are a few key measures we watch to determine the health of the US debt market. One is the Direct to Indirect bids. Indirect Bids are the Dealer / Broker community. They are the major players that make up the volume of the transactions and who sell the debt securities in the open market. The Direct Bidders are smaller players such as the public and foreign investors, amongst others who want to avoid the broker/dealer fees and buy direct. From above, we would expect to see volume falling off. It isn’t.


The reason is that we have a mysterious Direct bidder (or possibly more than one) taking up unprecedented auction volume and thereby achieving acceptable bid to cover ratios, which the market also watches closely.    Who this mysterious bidder is, no one is being told. There is endless speculation because if they fail to show up at the next auction, all hell will break loose. Someone has deep pockets somewhere and for some reason is buying US Treasuries. This is extremely convenient for the US government because it is presently keeping interest rates down and not allowing the Auction to fail. Remember the panic when people perceived the Greek auction bond offering would fail? This would be a thermonuclear explosion in comparison.


If you still believe in the tooth fairy, then you believe this sudden Direct Bidder emergence is not suspicious. Meanwhile, the world cannot figure out why interest rates in America haven’t already vaulted higher. Most professionals are highly puzzled and perplexed.


MAJOR PARTICIPANTS REDUCING US TREASURY HOLDINGS


According to a report by Bloomberg, “PIMCO’s Bill Gross, who manages the world’s biggest bond fund, has reduced holdings of U.S. Government-related debt, while increasing his holding of emerging market debt the most since 2008. According to a report on the Newport Beach, California-based PIMCO’s website, Gross has reduced the proportion of U.S. government and related securities in the 219.7 Billion total return fund” (1). Separately, Gross said he was raising cash. This means PIMCO is selling US Treasury securities. You can only conclude they would not be the only major bond fund executing this strategy.


“Bonds have seen their best days,” Gross said in a March 25 interview with Tom Keene on Bloomberg Radio. Pimco is advising investors to buy the debt of countries such as Germany and Canada that have low deficits and corporate securities with relatively high yields “

Bloomberg 04-14-10


Additionally, we read in the latest US Treasury TIPS report China has trimmed its holdings of US Treasury debt 1.3 percent or $11.5B in February, the fourth consecutive decline.


How could this obvious and significantly weakened demand pressure not be reflected in the bond market? Clearly, this is exactly what the professional indirect bidders are also signaling with their bidding. Magically, the auction still comes off thanks to the unknown tooth fairy. Who is this tooth fairy, what is their motivations and most importantly how is it securing these levels of debt purchases? What collateral may it possibly be pledging?


http://home.comcast.net/~lcmgroupe/2010/Article-Extend_Pretend-Gaming_the_US_Tax_Payer.htm

Not Good To Say The Least…….PLUMMETING U.S. MONEY SUPPLY Despite QE (Quantitative Easing)

Posted By on April 18, 2010

PLUMMETING US MONEY SUPPLY DESPITE QE (Quantitative Easing)

 Money Supply

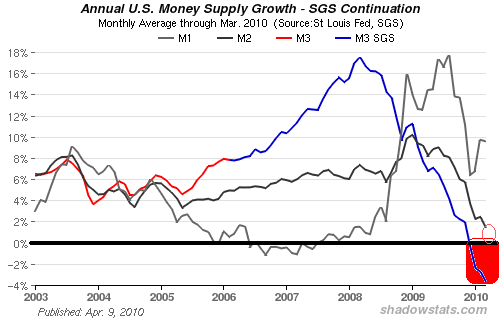
The chart above from Shadow Government Statistics is more than a little alarming. The M3 money supply reporting is shown above, which we all used to watch meticulously and was suddenly and suspiciously dropped without explanation in March 2007. John Williams of Shadow Government Statistics still rigorously tracks it. According to William’s models it now went negative. This is a major concern that the M3 slope has been heading down since the 2008 financial crisis occurred, but a much bigger concern is that it has now turned negative. This means money supply as measured by the M3 is contracting. We also see that the narrower M2 measure is fast approaching that critical event. This is huge news that is receiving little attention since it is no longer published by the government. A few years ago this news would have shaken financial markets.

The demarcation from zero, means the money supply is now contracting and therefore there is less money available in circulation to buy such financial assets as US Treasury securities. Since there is less money available, it should indicate that new US Treasury bond offering would be facing lower prices and hence higher yields. Minimally, we should be seeing pressures in the bid to cover ratios in the US Treasury Auction. Surprisingly, we are not.

http://home.comcast.net/~lcmgroupe/2010/Article-Extend_Pretend-Gaming_the_US_Tax_Payer.htm

The New World Of Mortgage Servicing Loss Mitigation

Posted By on April 18, 2010

Welcome to the world of mortgage servicing loss mitigation…

We now have the situation in this country where after delinquent borrowers are offered a loan modification option which takes the interest rate down to 2% for 5 years, extends the mortgage term to 40 years and forebears (soon will forgive) some of the principal balance if necessary, many are telling the mortgage servicer… “come back to me when you have a better program.” And this is with these programs often reducing the borrower’s payments by 30% or more already.

These are people who in years past would have been foreclosed on and moved out of their house.

While there are legitimate business reasons to help delinquent borrowers who really need help, and are willing to work with the mortgage company, I think we have crossed over the line.

Our government is in the process of creating the ultimate long term moral hazard. Guess who is paying for all of this?

For Consumers, Time to Shop (Until the Mortgage Drops)

…we’ve got millions upon millions of consumers in the U.S. meeting their shelter needs for free, even if only temporarily; and what’s becoming of any extra disposable income, since no rent or mortgage need be paid? Is this money being saved? Of course not. We’re Americans — we don’t know how to save (and neither does our government, apparently).

Put simply: people are spending their mortgages.

Consider the following individual as a case study — an actual ‘HAMPlicant’ at one of the nation’s larger servicing shops, as highlighted in a guest post at the Calculated Risk blog. They had an $1,880 monthly payment on their mortgage they’d defaulted on, yet their bank statements for the past 30 days included the following expenses:

  • visits to the tanning salon
  • visits to the nail spa
  • some kind of gourmet produce market
  • various liquor stores
  • A DirecTV bill that involved some serious premium programming or pay-per-view events
  • Over $1,700 in retail purchases, including: Best Buy, Baby Gap, Brookstone, Old Navy, Bed, Bath & Beyond, Home Depot, Macy’s, Pac Sun, Urban Behavior, Sears, Staples, and Footlocker

Here’s one household that’s clearly doing their part to ensure that consumer spending stays strong. Any sane person should be asking themselves: How many more people like this are out there among the 7.4 million delinquent loans we now have? And how many more ’spenders’ are there among the 5 million or so currently underwater homeowners — many of whom may at some point decide to default on their mortgage, too, but dutifully continue spending at Best Buy and eating at the Cheesecake Factory?

The article above pretty much confirms that much of the economic news we have recently seen on positive retail sales is probably nothing but a mirage as a leading economic indicator…

www.jsmineset.com

Seems Logical……Jim Sinclair’s Commentary

Posted By on April 18, 2010

Who paid the bonuses for Wall Street and how it worked:

1. FASB capitulates and allows holders of OTC derivatives to value them at whatever they wish.
2. International investment firms begin strong mark up policies towards their crap inventory.
3. Profits from the mark up of crap OTC derivatives by the international investment firms is recognized as trading income.
4. Tarp money comes into the firms and goes out as bonuses to the management, trading department and general employees at obscene levels.
5. Stock and bond issues are made to pay back tarp funds.
6. Therefore the money bonuses out by the international investment firms were TARP funds, not real earnings, but false FASB permitted mark up paper earnings through the trading department and declared as trading income.
7. The TARP money was paid back through the issue of stocks and bonds to the public, therefore the public paid the TARP back, not the financial institutions.
8. The obscene level of bonuses is because this game of convert false paper profit into cash into the bank account of the banksters and their merry crew is now game over. It was the last dip at the well of public funds laundered via TARP of the caved in FASB.
9. In the final analysis the public paid those obscene bonuses that were in truth, unearned.

www.jsmineset.com

Goldman Sachs Sued by SEC for Fraud Tied to CDOs

Posted By on April 16, 2010

Goldman Sachs Sued by SEC for Fraud Tied to CDOs 

By Joshua Gallu and Christine Harper

April 16 (Bloomberg) — Goldman Sachs Group Inc. was sued by U.S. regulators for fraud tied to collateralized debt obligations that contributed to the worst financial crisis since the Great Depression. The firm’s shares tumbled as much as 16 percent and financial stocks slumped.

Goldman Sachs misstated and omitted key facts about a financial product tied to subprime mortgages as the U.S. housing market was starting to falter, the Securities and Exchange Commission said in a statement today. The SEC also sued Fabrice Tourre, a Goldman Sachs vice president.

“The product was new and complex but the deception and conflicts are old and simple,” SEC Enforcement Director Robert Khuzami said in the statement. “Goldman wrongly permitted a client that was betting against the mortgage market to heavily influence which mortgage securities to include in an investment portfolio, while telling other investors that the securities were selected by an independent, objective third party.”

The SEC alleged that Goldman Sachs, led by Chief Executive Officer Lloyd Blankfein, 55, structured and marketed CDOs that hinged on the performance of subprime mortgage-backed securities. The New York-based firm failed to disclose to investors that hedge fund Paulson & Co. was betting against the CDO, known as Abacus, and influenced the selection of securities for the portfolio, the SEC said. Paulson wasn’t accused of wrongdoing.

http://www.bloomberg.com/apps/news?pid=20601087&sid=agT1H2ffyJCA

Jim Sinclair’s Commentary

If you think that Goldman’s problems are not shared by the entire derivative market, you are bonkers.

If you see the Goldman situation as negative to gold you are a total fool.

If you see the Goldman situation as being bullish to the dollar, you are hopeless.

Goldman Real Estate Fund Down To $30m From $1.8 Billion

Posted By on April 15, 2010

By Henny Sender in New York

Published: April 16 2010

Whitehall Street International, Goldman Sachs’ international real estate investment fund, has lost almost all of its $1.8bn of equity following soured property investments in the US, Germany and Japan, according to the fund’s estimates.

By the end of 2009, the fund was down to its last $30m, a paper loss of about 98 cents on the dollar, an annual report sent to investors last month said. The report said that Goldman was Whitehall’s largest investor, with a commitment of $436m. Last year, Goldman took a loss of $1.76bn from all its real estate principal investments.

www.financialtimes.com

George Soros Warns Of Biggest Market Crash To Come, As “We Are Facing A Yet Larger Bubble” Than During Credit Crisis

Posted By on April 15, 2010

04/15/2010

George Soros, speaking at a meeting organized by The Economist, warns all those who are throwing their money into the equity pit, that “the financial world is on the wrong track and that we may be hurtling towards an even bigger boom and bust than in the credit crisis.” Advice from Soros or from CNBC. You decide. Reuters reports that Soros said “the same strategy of borrowing and spending that had got us out of the Asian crisis could shunt us towards another crisis unless tough lessons are learned.” We hope all those who are buying stocks have very tight stop loss triggers.

“The success in bailing out the system on the previous occasion led to a superbubble, except that in 2008 we used the same methods,” he told a meeting hosted by The Economist at the City of London’s modern and impressive Haberdashers’ Hall.

“Unless we learn the lessons, that markets are inherently unstable and that stability needs to the objective of public policy, we are facing a yet larger bubble.

“We have added to the leverage by replacing private credit with sovereign credit and increasing national debt by a significant amount.”

The one thing allowing those invested to sleep at night is the observation that it took 10 years between the 1998 Asian crisis and the 2008 credit crisis. “If the pattern is repeated, it should at least mean we have another 8 years to go before the next crash.”

We would take the under on that. In 1998 and all the way through 2008, developed countries as a percentage of their GDPs were at most half od where they are now. At this point the entire credit house of cards continues to exist only so long as credit conditions for US sovereign debt can be massaged by the Fed enough that the world forgets there are is $10 trillion in debt issuance on deck over the next decade (a conservative estimate). It is a virtual impossibility that the money printer of even what may still be considered the reserve currency (although that distinction is rapidly shifting back to gold once again) can withhold a multi-trillion issuance onslaught and a multi-trillion corporate/CRE refi wave with 10 Years at under 4%. The next crisis will, as Soros points out, begin in the sovereign debt arena. In fact, it has already begun. Here is Reuters with an extended report on Greece’s formal request for IMF aid. Net result – add another $560 billion in public leverage to the system.

www.zerohedge.com

Oh My God, You’ve Got To Be Kidding…..The Bill We Passed Is What?

Posted By on April 14, 2010

Emperor Has No Cloths

Morgan Stanley Property Fund May Lose 66% Of Its Money

Posted By on April 13, 2010

  • APRIL 14, 2010
  • Morgan Stanley has told investors in its $8.8 billion real-estate fund that it may lose nearly two-thirds of its money from bum property investments, according to fund documents reviewed by The Wall Street Journal.

    That would likely make it the biggest dollar loss—$5.4 billion—in the history of private-equity real-estate investing. Over the past 20 years, Morgan Stanley’s real-estate unit was one of the biggest buyers of property around the world, doing some $174 billion in deals since 1991, mostly with money raised from pension funds, college endowments and foreign investors. The losses come from investments in properties such as the European Central Bank’s Frankfurt headquarters, a big development project in Tokyo and InterContinental hotels across Europe, among others.

    From www.wsj.com

    Are We Starting A Trade War With China?

    Posted By on April 13, 2010

    Last week the US put duties on Chinese steel pipe. This week China puts duties on US and Russian electrical steel.  Getting into a trade war now is as crazy as the Smoot-Hawley Tariff Act was in the 1930s.

    Remember this………

    China will do only what China wants. 
    China will do only what China wants when it wants.
    China cannot be bullied into doing anything that hurts China.

    China puts duties on US, Russian electrical steel

    (AP:BEIJING) China announced antidumping duties of up to 64.8 percent on U.S. and Russian steel used by the power industry Tuesday amid a series of disputes with the United States and other trading partners.

    Investigators also found U.S. producers of flat-rolled electrical steel received subsidies, the Commerce Ministry said.

    “That has hurt the Chinese industry substantially,” the ministry said on its Web site.

    Duties of 7.8 percent were imposed on AK Steel Corp. and 19.9 percent on Allegheny Ludlum Corp., the two U.S. companies that responded to a one-year-long probe, while the rate was 64.8 percent for other U.S. producers, the ministry said. AK steel also faces anti-subsidy duties of 11.7 percent and Lodium 12 percent.

    The measures took effect Saturday.

    Russian producers OJSC Novolipetsk Steel and VIZ-Stal Ltd. were slapped with antidumping duties of 6.3 percent while other Russian companies were hit with a 24 percent duty.

    Kyrgyzstan And The Russian Resurgence

    Posted By on April 13, 2010

    April 13, 2010 | 0854 GMT


    By Lauren Goodrich

    This past week saw another key success in Russia’s resurgence in former Soviet territory when pro-Russian forces took control of Kyrgyzstan.

    The Kyrgyz revolution was quick and intense. Within 24 hours, protests that had been simmering for months spun into countrywide riots as the president fled and a replacement government took control. The manner in which every piece necessary to exchange one government for another fell into place in such a short period discredits arguments that this was a spontaneous uprising of the people in response to unsatisfactory economic conditions. Instead, this revolution appears prearranged.

    A Prearranged Revolution

    Opposition forces in Kyrgyzstan have long held protests, especially since the Tulip Revolution in 2005 that brought recently ousted President Kurmanbek Bakiyev to power. But various opposition groupings never were capable of pulling off such a full revolution — until Russia became involved.

    In the weeks before the revolution, select Kyrgyz opposition members visited Moscow to meet with Russian Prime Minister Vladimir Putin. STRATFOR sources in Kyrgyzstan reported the pervasive, noticeable presence of Russia’s Federal Security Service on the ground during the crisis, and Moscow readied 150 elite Russian paratroopers the day after the revolution to fly into Russian bases in Kyrgyzstan. As the dust began to settle, Russia endorsed the still-coalescing government.

    There are quite a few reasons why Russia would target a country nearly 600 miles from its borders (and nearly 1,900 miles from capital to capital), though Kyrgyzstan itself is not much of a prize. The country has no economy or strategic resources to speak of and is highly dependent on all its neighbors for foodstuffs and energy. But it does have a valuable geographic location.

    Central Asia largely comprises a massive steppe of more than a million square miles, making the region easy to invade. The one major geographic feature other than the steppe are the Tien Shan mountains, a range that divides Central Asia from South Asia and China. Nestled within these mountains is the Fergana Valley, home to most of Central Asia’s population due to its arable land and the protection afforded by the mountains. The Fergana Valley is the core of Central Asia.


    Kyrgyzstan and the Russian Resurgence

    Click image to enlarge


    To prevent this core from consolidating into the power center of the region, the Soviets sliced up the Fergana Valley between three countries. Uzbekistan holds the valley floor, Tajikistan the entrance to the valley and Kyrgyzstan the highlands surrounding the valley. Kyrgyzstan lacks the economically valuable parts of the valley, but it does benefit from encircling it. Control of Kyrgyzstan equals control of the valley, and hence of Central Asia’s core.

    Moreover, the Kyrgyz capital of Bishkek is only 120 miles from Kazakhstan’s largest city (and historic and economic capital), Almaty. The Kyrgyz location in the Tien Shan also gives Kyrgyzstan the ability to monitor Chinese moves in the region. And its highlands also overlook China’s Tarim Basin, part of the contentious Xinjiang Uighur Autonomous Region.

    Given its strategic location, control of Kyrgyzstan offers the ability to pressure Kazakhstan, Uzbekistan, Tajikistan and China. Kyrgyzstan is thus a critical piece in Russia’s overall plan to resurge into its former Soviet sphere.

    The Russian Resurgence

    Russia’s resurgence is a function of its extreme geographic vulnerability. Russia lacks definable geographic barriers between it and other regional powers. The Russian core is the swath of land from Moscow down into the breadbasket of the Volga region. In medieval days, this area was known as Muscovy. It has no rivers, oceans or mountains demarcating its borders. Its only real domestic defenses are its inhospitable weather and dense forests. This led to a history of endless invasions, including depredations by everyone from Mongol hordes to Teutonic knights to the Nazis.

    To counter this inherent indefensibility, Russia historically has adopted the principle of expansion. Russia thus has continually sought to expand far enough to anchor its power in a definable geographic barrier — like a mountain chain — or to expand far enough to create a buffer between itself and other regional powers. This objective of expansion has been the key to Russia’s national security and its ability to survive. Each Russian leader has understood this. Ivan the Terrible expanded southwest into the Ukrainian marshlands, Catherine the Great into the Central Asian steppe and the Tien Shan and the Soviet Union into much of Eastern and Central Europe.

    Russia’s expansion has been in four strategic directions. The first is to the north and northeast to hold the protection offered by the Ural Mountains. This strategy is more of a “just-in-case” expansion. Thus, in the event Moscow should ever fall, Russia can take refuge in the Urals and prepare for a future resurgence. Stalin used this strategy in World War II when he relocated many of Russia’s industrial towns to Ural territory to protect them from the Nazi invasion.

    The second is to the west toward the Carpathians and across the North European Plain. Holding the land up to the Carpathians — traditionally including Ukraine, Moldova and parts of Romania — creates an anchor in Europe with which to protect Russia from the southwest. Meanwhile, the North European Plain is the one of the most indefensible routes into Russia, offering Russia no buffer. Russia’s objective has been to penetrate as deep into the plain as possible, making the sheer distance needed to travel across it toward Russia a challenge for potential invaders.

    The third direction is south to the Caucasus. This involves holding both the Greater and Lesser Caucasus mountain ranges, creating a tough geographic barrier between Russia and regional powers Turkey and Iran. It also means controlling Russia’s Muslim regions (like Chechnya, Ingushetia and Dagestan), as well as Georgia, Armenia and Azerbaijan.

    The fourth is to the east and southeast into Siberia and Central Asia. The Tien Shan mountains are the only geographic barrier between the Russian core and Asia; the Central Asian steppe is, as its name implies, flat until it hits Kyrgyzstan’s mountains.

    With the exception of the North European Plain, Russia’s expansion strategy focuses on the importance of mountains — the Carpathians, the Caucasus and Tien Shan — as geographic barriers. Holding the land up to these definable barriers is part of Russia’s greater strategy, without which Russia is vulnerable and weak.

    The Russia of the Soviet era attained these goals. It held the lands up to these mountain barriers and controlled the North European Plain all the way to the West German border. But its hold on these anchors faltered with the fall of the Soviet Union. This collapse began when Moscow lost control over the fourteen other states of the Soviet Union. The Soviet disintegration did not guarantee, of course, that Russia would not re-emerge in another form. The West — and the United States in particular — thus saw the end of the Cold War as an opportunity to ensure that Russia would never re-emerge as the great Eurasian hegemon.

    To do this, the United States began poaching among the states between Russia and its geographic barriers, taking them out of the Russian sphere in a process that ultimately would see Russian influence contained inside the borders of Russia proper. To this end, Washington sought to expand its influence in the countries surrounding Russia. This began with the expansion of the U.S. military club, NATO, into the Baltic states in 2004. This literally put the West on Russia’s doorstep (at their nearest point, the Baltics are less than 100 miles from St. Petersburg) on one of Russia’s weakest points on the North European Plain.

    Washington next encouraged pro-American and pro-Western democratic movements in the former Soviet republics. These were the so-called “color revolutions,” which began in Georgia in 2003 and moved on to Ukraine in 2004 and Kyrgyzstan in 2005. This amputated Russia’s three mountain anchors.

    The Orange Revolution in Ukraine proved a breaking point in U.S.-Russian relations, however. At that point, Moscow recognized that the United States was seeking to cripple Russia permanently. After Ukraine turned orange, Russia began to organize a response.

    The Window of Opportunity

    Russia received a golden opportunity to push back on U.S. influence in the former Soviet republics and redefine the region thanks to the U.S. wars in Afghanistan and Iraq and the crisis with Iran. Its focus on the Islamic world has left Washington with a limited ability to continue picking away at the former Soviet space or to counter any Russian responses to Western influence. Moscow knows Washington won’t stay fixated on the Islamic world for much longer, which is why Russia has accelerated its efforts to reverse Western influence in the former Soviet sphere and guarantee Russian national security.

    In the past few years, Russia has worked to roll back Western influence in the former Soviet sphere country by country. Moscow has scored a number of major successes in 2010. In January, Moscow signed a customs union agreement to economically reintegrate Russia with Kazakhstan and Belarus. Also in January, a pro-Russian government was elected in Ukraine. And now, a pro-Russian government has taken power in Kyrgyzstan.

    The last of these countries is an important milestone for Moscow, given that Russia does not even border Kyrgyzstan. This indicates Moscow must be secure in its control of territory from the Russian core across the Central Asian Steppe.

    As it seeks to roll back Western influence, Russia has tested a handful of tools in each of the former Soviet republics. These have included political pressure, social instability, economic weight, energy connections, security services and direct military intervention. Thus far, the pressure brought on by its energy connections — as seen in Ukraine and Lithuania — has proved most useful. Russia has used the cutoffs of supplies to hurt the countries and garner a reaction from Europe against these states. The use of direct military intervention — as seen in Georgia — also has proved successful, with Russia now holding a third of that country’s land. Political pressure in Belarus and Kazakhstan has pushed the countries into signing the aforementioned customs union. And now with Kyrgyzstan, Russia has proved willing to take a page from the U.S. playbook and spark a revolution along the lines of the pro-Western color revolutions. Russian strategy has been tailor-made for each country, taking into account their differences to put them into Moscow’s pocket — or at least make them more pragmatic toward Russia.

    Thus far, Russia has nearly returned to its mountain anchors on each side, though it has yet to sew up the North European Plain. And this leaves a much stronger Russia for the United States to contend with when Washington does return its gaze to Eurasia.

    Reprinting or republication of this report on websites is authorized by prominently displaying the following sentence at the beginning or end of the report, including the hyperlink to STRATFOR:

    “This report is republished with permission of STRATFOR

    http://www.stratfor.com

    Visualizing America’s Tax Inequality

    Posted By on April 12, 2010

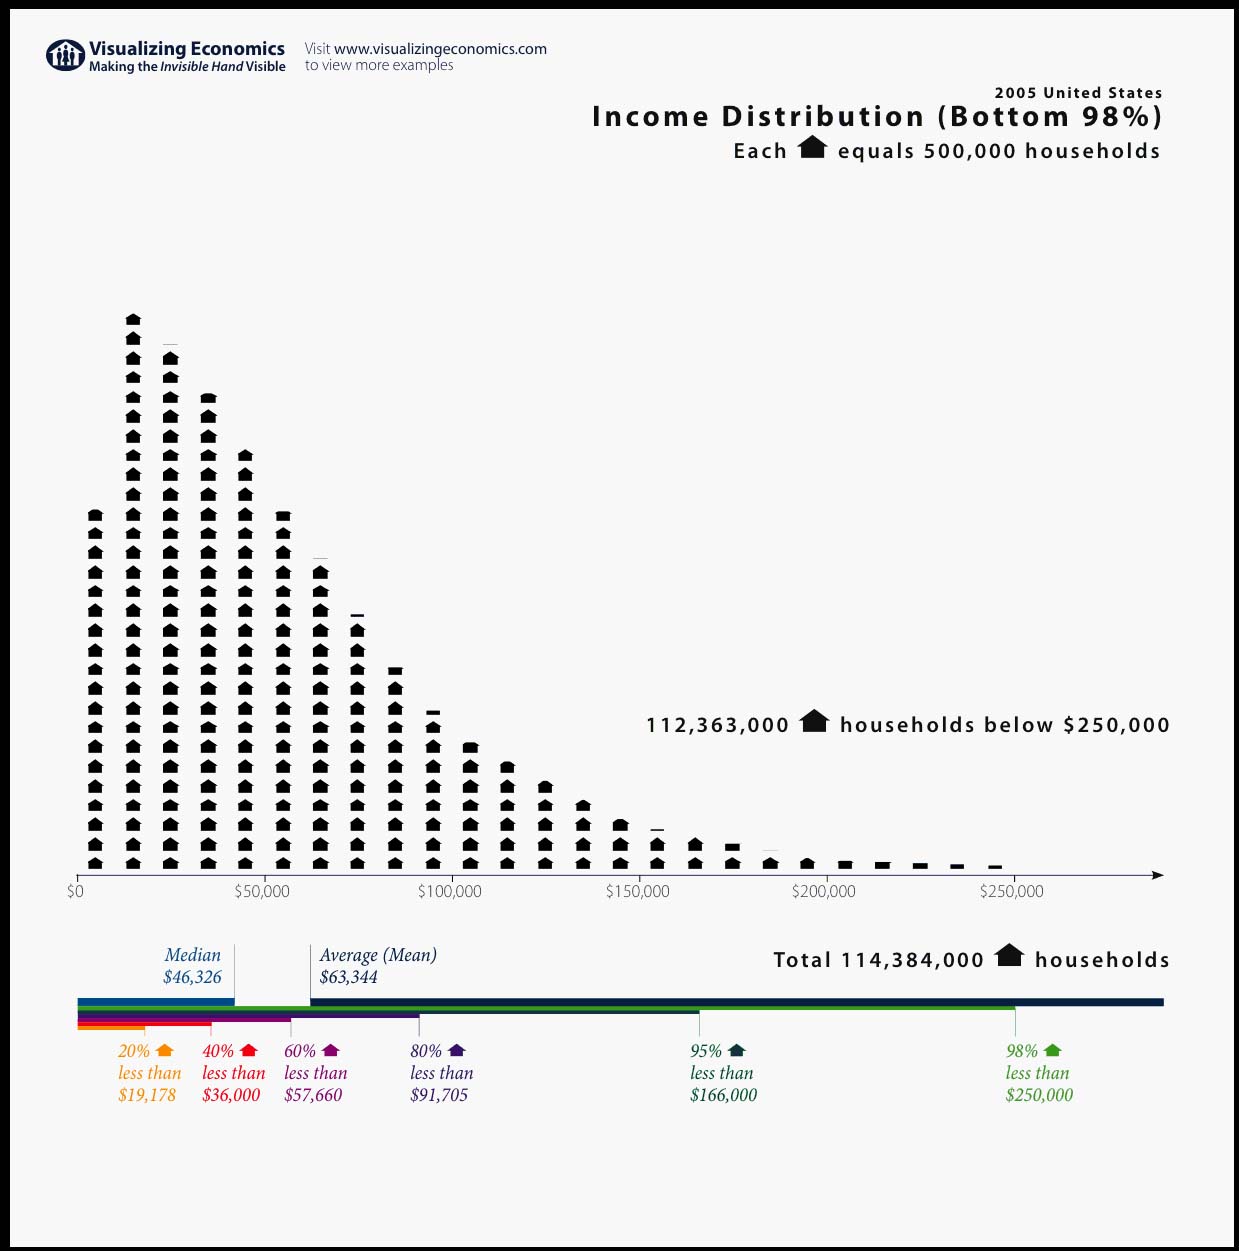
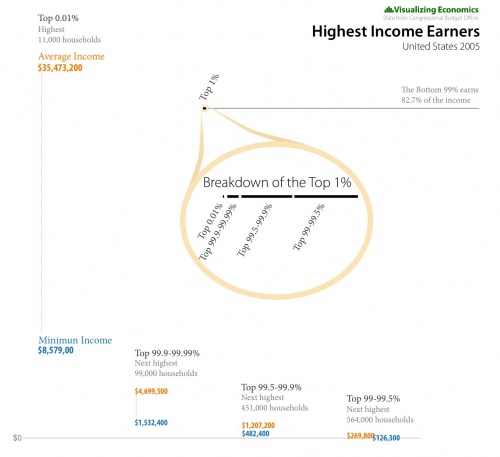
    As the charts below demonstrate, American society is currently stratified beyond repair. In this vein, the Tax Policy Center calculates, that for a return to economic normalcy, or deficits at a “mere” 2% of GDP, households earnings more than $200/250k would see their tax rates going up to a stunning 91%. If the economic underperformance target is reduced to more palatable deficits at 3% of GDP, then the top earners would be hit with “only” 77% taxes.

    A summary of the details:

    • 40% of US households make below $36,000
    • 60% make below $57,000
    • 80% make below $91,750
    • 95% making below $165k
    • 98% making less than $250,000
    • 99.99% make less than $5 million and 0.01% make more than $5 million (with a very special category for those making over $1.5 billion: “Hedge Fund Managers”)
    • 1% of society makes 17.3% of the income,
    • The average income in the top 0.01%, or 11,000 households, is $35,473,200, and a minimum of $8,579,000
    • The average income in the the next 99,000 households, or 99.9%-99.99% of the population makes an average $4,699,500, and a minimum of $1,532,400
    • The average income in the next 451,000 households, or 99.5%-99.9% of the population makes and average $1,206,200, and a minimum of $482,400
    • The average income in the next 564,000 households, or 99$-99.5% of the population makes and average $269,800, and a minimum of $126,300
    • …and so forth.

    Here are the charts that capture the stratification of America, and its new “nobility” class, courtesy of Visualizing Economics:

    Income Distribution

    The Nobility

    www.zerohedge.com

    Let’s Hope This Doesn’t Happen, But If It Does………….

    Posted By on April 12, 2010

    Sovereign Debt Disaster Will Favor Hard Assets
    by Justice Litle, Editor, Macro Trader
    April 12, 2010

    In the event of a full-blown sovereign debt crisis, hard assets will become deeply desirable as one of the few “stores of value” left.

    …all too often the size of debts, especially government debts, is hidden from investors until it comes jumping out of the woodwork after a crisis. – Prof. Ken Rogoff, Financial Times column, “Bubbles lurk in government debt”

    Last week, in “How to Protect Against Currency Collapse,” we talked about the mounting debt problem and how Western governments will deal with it.

    If the debt is issued in your own currency, you ultimately just print more currency to inflate that debt away. (If the debt is issued in someone else’s currency, you are in deep trouble… as Greece, Latvia, Iceland and others have all found out.)

    Right now the global economic recovery has the appearance of being cost-free. This is due to an age-old confidence trick known as “ignoring the bill.” To pull off this trick, you spend huge amounts of money on a high-limit credit card… ignore the mail when the bill comes due… and conveniently forget to reconcile your accounts.

    Complacency reigns because the true costs are not being tallied. The Bank for International Settlements – an age-old central banking watchdog based in Switzerland – is having none of it.

    The “simmering fiscal problem” of sovereign debt is set to bring industrial economies “to the boiling point,” the BIS reports in a new study. “Bond traders are notoriously short-sighted,” the BIS further scolds, “assuming they can get out before the storm hits… the question is when markets will start putting pressure on governments, not if.”

    The Bank of International Settlements further believes that, if we do not turn from this path, inflation will spiral out of control. “Monetary policy may ultimately become impotent to control inflation,” the BIS scowls, “regardless of the fighting credentials of the central bank.”

    Not China or Japan

    Last week, readers wrote in to ask whether China’s currency might count as a viable hedge against collapse – perhaps through a vehicle like the Dreyfus Chinese Yuan Fund (CYB:NYSE).

    The answer there would have to be: “Nope. Too risky.” China’s fortunes are still deeply linked to those of the United States:

    • China’s currency is still pegged to the USD.
    • China’s economic future is still heavily dependent on exports.
    • China still owns massive quantities of U.S. Treasuries.

    The above factors make it hard to determine how China will fare in the event of Western currency meltdown. The Japanese yen is also a deeply risky proposition, given its heavy export dependence, major UST holdings and massive internal debts.

    This all goes back to a talk your editor gave in Chicago last summer, discussing the shape of the world’s next reserve currency. The gist was that all those who would seek to dethrone “King Dollar” are impostors.

    China’s currency regime is not ready for primetime. Japan is struggling with a demographic death spiral. And the euro is crumbling before our very eyes.

    In a paper-debased world, that leaves hard assets as the last option standing.

    Where Have You Gone, Joe DiMaggio

    Try as they might, investors will not be able to ignore the sovereign debt problem forever. When the reckoning comes due, the printing presses will kick into hyperdrive… and faith in the system will crumble (or perhaps shatter like brittle glass).

    At this point, investors will turn their lonely eyes to hard assets, looking at precious metals and basic building-block commodities in a new light.

    Up till now, hard assets have more or less been treated as a “hot money” play on global economic recovery. Price movements have been linked to speculative appetite and the general degree of optimism.

    The onset of a sovereign debt panic could thus lead to a short, sharp and temporary drop in hard asset prices, as the “hot money” beats a hasty retreat. But over time, a post-crisis shift in psychology will occur. In a world where all major currencies are being debased, oil and metal in the ground will stop looking like speculative plays and start looking more like stores of value.

    The Reuters/Jefferies CRB index tells the story of commodities’ lackluster performance. While equities have been going gangbusters, the CRB has been more or less flat for half a year.

    That is because focus remains on cost-free recovery for now. There is widespread belief that the U.S. economy is in a sweet spot, with a goldilocks-like ability to push profits up while keeping short-term interest rates near zero. The Fed is widely revered at moment for having succeeded in its mission. Some bulls are even musing aloud now whether the “great recession” was even all that “great” – as if it were over and done, finis, all consequences postponed indefinitely.

    It is an environment, in other words, that very much favors “paper” (leveraged financial plays) over “stuff” (hard assets).

    But when faith in Western governments’ ability to shoulder the sovereign debt load evaporates, that equation will reverse rapidly. (And as the BIS noted in its gloom-and-doom report, it is a question of “when,” not “if.”)

    And so, after a period of renewed fiscal panic, in which it is driven home, yet again, that the grossly indebted central bankers of the world do NOT have control – only the illusion of it – a need to take shelter from the ensuing inflationary paper-debasement storm will become paramount.

    THAT is when hard assets will become most attractive… not as hot money speculative vehicles, but emergency stores of value. A true rocket ride for commodity prices – the likes of which we haven’t seen yet – could be the result.

    A Simple Proxy

    The countries represented in the Ultra Resource Index CD were selected not just for their attractive cash positions, but their rich abundance of hard assets. Countries with vast quantities of natural resources “in the ground” – like Canada, Australia and Norway for instance – will be seen as sitting on vast treasure chests.

    Such resources would have permanent and lasting value even if the entire global financial system melted down completely. (People can go without paper, but they will always need to eat, drive, and build, and so on.) As the sovereign debt crisis unfolds, investors may well flock to these “hard” currencies in droves as their home-based scrip turns to confetti.

    Copyright © 2010 Justice Litle

    Macro Trader is the result of Editor Justice Litle’s nearly 15-year study of the market and the centuries old “Trader’s Key” principle, the core of the service. The combination of fast-paced trading recommendations and hands-on guidance from a seasoned market veteran makes Macro Trader a unique trading service.

    Truly a global trading research service, Macro Trader is in the market for profits trading all liquid asset classes: stocks, bonds, options, commodities and currencies. If it’s traded on a regulated exchange and has reasonable liquidity, it is fair game.

    This trading service is exclusively for BOLD individuals who want to find the absolute best reward-to-risk situations in the world…. regardless of global market conditions. With Justice’s expert guidance and his willingness to teach you the secrets of the “Trader’s Key,” joining Macro Trader could be the most profitable decision you ever make.

    www.financialsense.com

    Interest Rates Have Nowhere To Go But Up

    Posted By on April 11, 2010

    From The New York Times
    By NELSON D. SCHWARTZ
    Published: April 10, 2010

    Even as prospects for the American economy brighten, consumers are about to face a new financial burden: a sustained period of rising interest rates. 

    That, economists say, is the inevitable outcome of the nation’s ballooning debt and the renewed prospect of inflation as the economy recovers from the depths of the recent recession.

    The shift is sure to come as a shock to consumers whose spending habits were shaped by a historic 30-year decline in the cost of borrowing.

    “Americans have assumed the roller coaster goes one way,” said Bill Gross, whose investment firm, Pimco, has taken part in a broad sell-off of government debt, which has pushed up interest rates. “It’s been a great thrill as rates descended, but now we face an extended climb.”

    The impact of higher rates is likely to be felt first in the housing market, which has only recently begun to rebound from a deep slump. The rate for a 30-year fixed rate mortgage has risen half a point since December, hitting 5.31 last week, the highest level since last summer.

    Along with the sell-off in bonds, the Federal Reserve has halted its emergency $1.25 trillion program to buy mortgage debt, placing even more upward pressure on rates.

    “Mortgage rates are unlikely to go lower than they are now, and if they go higher, we’re likely to see a reversal of the gains in the housing market,” said Christopher J. Mayer, a professor of finance and economics at Columbia Business School. “It’s a really big risk.”

    Each increase of 1 percentage point in rates adds as much as 19 percent to the total cost of a home, according to Mr. Mayer.

    The Mortgage Bankers Association expects the rise to continue, with the 30-year mortgage rate going to 5.5 percent by late summer and as high as 6 percent by the end of the year.

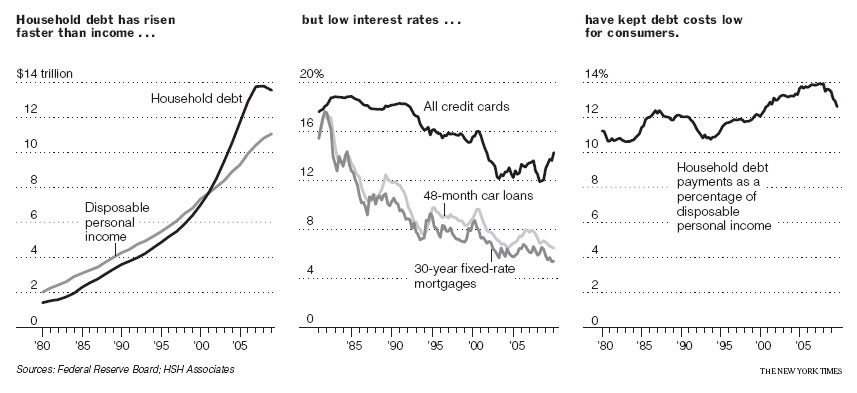
    Household Debt and Interest Rates

    From that peak, steadily dropping interest rates have fed a three-decade lending boom, during which American consumers borrowed more and more but managed to hold down the portion of their income devoted to paying off loans.

    Indeed, total household debt is now nine times what it was in 1981 — rising twice as fast as disposable income over the same period — yet the portion of disposable income that goes toward covering that debt has budged only slightly, increasing to 12.6 percent from 10.7 percent.

    Household debt has been dropping for the last two years as recession-battered consumers cut back on borrowing, but at $13.5 trillion, it still exceeds disposable income by $2.5 trillion.

    www.nytimes.com

    Social Networking Sites……Who Is Growing, And Who Is Not

    Posted By on April 9, 2010

    Social Networking Sites

    www.ingerletter.com

    111 More Reasons To Hate The New Health Care Plan………….

    Posted By on April 9, 2010

    Hey…….We didn’t make this up……Congress did!

    The House Republican Conference has compiled a list of all the new boards, bureaucracies, commissions, and programs created in H.R. 3962, Speaker Pelosi’s government health care plan:

    1.     Retiree Reserve Trust Fund (Section 111(d), p. 61)

    2.     Grant program for wellness programs to small employers (Section 112, p. 62)

    3.     Grant program for State health access programs (Section 114, p. 72)

    4.     Program of administrative simplification (Section 115, p. 76)

    5.     Health Benefits Advisory Committee (Section 223, p. 111)

    6.     Health Choices Administration (Section 241, p. 131)

    7.     Qualified Health Benefits Plan Ombudsman (Section 244, p. 138)

    8.     Health Insurance Exchange (Section 201, p. 155)

    9.     Program for technical assistance to employees of small businesses buying Exchange coverage (Section 305(h), p. 191)

    10.   Mechanism for insurance risk pooling to be established by Health Choices Commissioner (Section 306(b), p. 194)

    11.   Health Insurance Exchange Trust Fund (Section 307, p. 195)

    12.   State-based Health Insurance Exchanges (Section 308, p. 197)

    13.   Grant program for health insurance cooperatives (Section 310, p. 206)

    14.   “Public Health Insurance Option” (Section 321, p. 211)

    15.   Ombudsman for “Public Health Insurance Option” (Section 321(d), p. 213)

    16.   Account for receipts and disbursements for “Public Health Insurance Option” (Section 322(b), p. 215)

    17.   Telehealth Advisory Committee (Section 1191 (b), p. 589)

    18.   Demonstration program providing reimbursement for “culturally and linguistically appropriate services” (Section 1222, p. 617)

    19.   Demonstration program for shared decision making using patient decision aids (Section 1236, p. 648)

    20.   Accountable Care Organization pilot program under Medicare (Section 1301, p. 653)

    21.   Independent patient-centered medical home pilot program under Medicare (Section 1302, p. 672)

    22.   Community-based medical home pilot program under Medicare (Section 1302(d), p. 681)

    23.   Independence at home demonstration program (Section 1312, p. 718)

    24.   Center for Comparative Effectiveness Research (Section 1401(a), p. 734)

    25.   Comparative Effectiveness Research Commission (Section 1401(a), p. 738)

    26.   Patient ombudsman for comparative effectiveness research (Section 1401(a), p. 753)

    27.   Quality assurance and performance improvement program for skilled nursing facilities (Section 1412(b)(1), p. 784)

    28.   Quality assurance and performance improvement program for nursing facilities (Section 1412 (b)(2), p. 786)

    29.   Special focus facility program for skilled nursing facilities (Section 1413(a)(3), p. 796)

    30.   Special focus facility program for nursing facilities (Section 1413(b)(3), p. 804)

    31.   National independent monitor pilot program for skilled nursing facilities and nursing facilities (Section 1422, p. 859)

    32.   Demonstration program for approved teaching health centers with respect to Medicare GME (Section 1502(d), p. 933)

    33.   Pilot program to develop anti-fraud compliance systems for Medicare providers (Section 1635, p. 978)

    34.   Special Inspector General for the Health Insurance Exchange (Section 1647, p. 1000)

    35.   Medical home pilot program under Medicaid (Section 1722, p. 1058)

    36.   Accountable Care Organization pilot program under Medicaid (Section 1730A, p. 1073)

    37.   Nursing facility supplemental payment program (Section 1745, p. 1106)

    38.   Demonstration program for Medicaid coverage to stabilize emergency medical conditions in institutions for mental diseases (Section 1787, p. 1149)

    39.   Comparative Effectiveness Research Trust Fund (Section 1802, p. 1162)

    40.   “Identifiable office or program” within CMS to “provide for improved coordination between Medicare and Medicaid in the case of dual eligibles” (Section 1905, p. 1191)

    41.   Center for Medicare and Medicaid Innovation (Section 1907, p. 1198)

    42.   Public Health Investment Fund (Section 2002, p. 1214)

    43.   Scholarships for service in health professional needs areas (Section 2211, p. 1224)

    44.   Program for training medical residents in community-based settings (Section 2214, p. 1236)

    45.   Grant program for training in dentistry programs (Section 2215, p. 1240)

    46.   Public Health Workforce Corps (Section 2231, p. 1253)

    47.   Public health workforce scholarship program (Section 2231, p. 1254)

    48.   Public health workforce loan forgiveness program (Section 2231, p. 1258)

    49.   Grant program for innovations in interdisciplinary care (Section 2252, p. 1272)

    50.   Advisory Committee on Health Workforce Evaluation and Assessment (Section 2261, p. 1275)

    51.   Prevention and Wellness Trust (Section 2301, p. 1286)

    52.   Clinical Prevention Stakeholders Board (Section 2301, p. 1295)

    53.   Community Prevention Stakeholders Board (Section 2301, p. 1301)

    54.   Grant program for community prevention and wellness research (Section 2301, p. 1305)

    55.   Grant program for research and demonstration projects related to wellness incentives (Section 2301, p. 1305)

    56.   Grant program for community prevention and wellness services (Section 2301, p. 1308)

    57.   Grant program for public health infrastructure (Section 2301, p. 1313)

    58.   Center for Quality Improvement (Section 2401, p. 1322)

    59.   Assistant Secretary for Health Information (Section 2402, p. 1330)

    60.   Grant program to support the operation of school-based health clinics (Section 2511, p. 1352)

    61.   Grant program for nurse-managed health centers (Section 2512, p. 1361)

    62.   Grants for labor-management programs for nursing training (Section 2521, p. 1372)

    63.   Grant program for interdisciplinary mental and behavioral health training (Section 2522, p. 1382)

    64.   “No Child Left Unimmunized Against Influenza” demonstration grant program (Section 2524, p. 1391)

    65.   Healthy Teen Initiative grant program regarding teen pregnancy (Section 2526, p. 1398)

    66.   Grant program for interdisciplinary training, education, and services for individuals with autism (Section 2527(a), p. 1402)

    67.   University centers for excellence in developmental disabilities education (Section 2527(b), p. 1410)

    68.   Grant program to implement medication therapy management services (Section 2528, p. 1412)

    69.   Grant program to promote positive health behaviors in underserved communities (Section 2530, p. 1422)

    70.   Grant program for State alternative medical liability laws (Section 2531, p. 1431)

    71.   Grant program to develop infant mortality programs (Section 2532, p. 1433)

    72.   Grant program to prepare secondary school students for careers in health professions (Section 2533, p. 1437)

    73.   Grant program for community-based collaborative care (Section 2534, p. 1440)

    74.   Grant program for community-based overweight and obesity prevention (Section 2535, p. 1457)

    75.   Grant program for reducing the student-to-school nurse ratio in primary and secondary schools (Section 2536, p. 1462)

    76.   Demonstration project of grants to medical-legal partnerships (Section 2537, p. 1464)

    77.   Center for Emergency Care under the Assistant Secretary for Preparedness and Response (Section 2552, p. 1478)

    78.   Council for Emergency Care (Section 2552, p 1479)

    79.   Grant program to support demonstration programs that design and implement regionalized emergency care systems (Section 2553, p. 1480)

    80.   Grant program to assist veterans who wish to become emergency medical technicians upon discharge (Section 2554, p. 1487)

    81.   Interagency Pain Research Coordinating Committee (Section 2562, p. 1494)

    82.   National Medical Device Registry (Section 2571, p. 1501)

    83.   CLASS Independence Fund (Section 2581, p. 1597)

    84.   CLASS Independence Fund Board of Trustees (Section 2581, p. 1598)

    85.   CLASS Independence Advisory Council (Section 2581, p. 1602)

    86.   Health and Human Services Coordinating Committee on Women’s Health (Section 2588, p. 1610)

    87.   National Women’s Health Information Center (Section 2588, p. 1611)

    88.   Centers for Disease Control Office of Women’s Health (Section 2588, p. 1614)

    89.   Agency for Healthcare Research and Quality Office of Women’s Health and Gender-Based Research (Section 2588, p. 1617)

    90.   Health Resources and Services Administration Office of Women’s Health (Section 2588, p. 1618)

    91.   Food and Drug Administration Office of Women’s Health (Section 2588, p. 1621)

    92.   Personal Care Attendant Workforce Advisory Panel (Section 2589(a)(2), p. 1624)

    93.   Grant program for national health workforce online training (Section 2591, p. 1629)

    94.   Grant program to disseminate best practices on implementing health workforce investment programs (Section 2591, p. 1632)

    95.   Demonstration program for chronic shortages of health professionals (Section 3101, p. 1717)

    96.   Demonstration program for substance abuse counselor educational curricula (Section 3101, p. 1719)

    97.   Program of Indian community education on mental illness (Section 3101, p. 1722)

    98.   Intergovernmental Task Force on Indian environmental and nuclear hazards (Section 3101, p. 1754)

    99.   Office of Indian Men’s Health (Section 3101, p. 1765)

    100.Indian Health facilities appropriation advisory board (Section 3101, p. 1774)

    101.Indian Health facilities needs assessment workgroup (Section 3101, p. 1775)

    102.Indian Health Service tribal facilities joint venture demonstration projects (Section 3101, p. 1809)

    103.Urban youth treatment center demonstration project (Section 3101, p. 1873)

    104.Grants to Urban Indian Organizations for diabetes prevention (Section 3101, p. 1874)

    105.Grants to Urban Indian Organizations for health IT adoption (Section 3101, p. 1877)

    106.Mental health technician training program (Section 3101, p. 1898)

    107.Indian youth telemental health demonstration project (Section 3101, p. 1909)

    108.Program for treatment of child sexual abuse victims and perpetrators (Section 3101, p. 1925)

    109.Program for treatment of domestic violence and sexual abuse (Section 3101, p. 1927)

    110.Native American Health and Wellness Foundation (Section 3103, p. 1966)

    111.Committee for the Establishment of the Native American Health and Wellness Foundation (Section 3103, p. 1968)

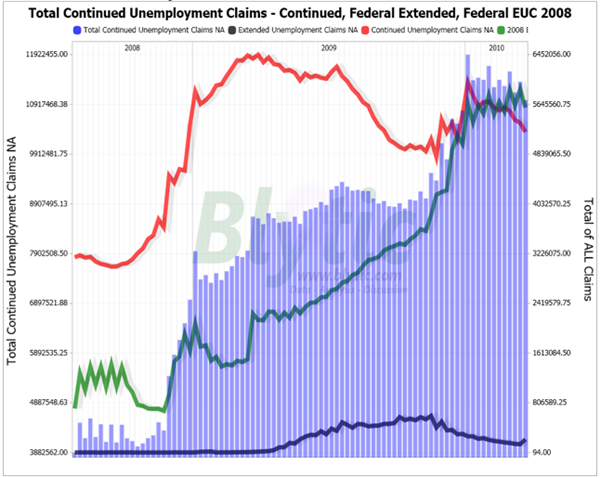
    Total Continued Unemployment Claims….Not Improving Like It Should

    Posted By on April 8, 2010

    Unmployment Claims

    www.ingerletter.com

    This Sums Things Up In A Nutshell

    Posted By on April 7, 2010

    In A Nut Shell

    www.ingerletter.com

    Consumer Credit Still Falling

    Posted By on April 7, 2010

    Consumer Credit

    Fannie Mae On Real Estate…..Hint, It’s Not Good

    Posted By on April 7, 2010

    From Fannie Mae on housing………………..

    Housing Shaky At Best – CNBC’s Diana Olick had a somewhat scary report on foreclosures yesterday.  She suggests a new wave is coming and it may be a whopper.  She quotes the Fannie Mae chief as saying that home prices will dip again before hitting a new bottom later this year (the report is on CNBC website).  The housing struggle is underscored by this morning’s report on mortgage applications.  Applications fell 11% (primarily on re-fis).  The report cited a significant jump in mortgage rates last week.  Watch the ten year Treasury and stay tuned.

    An Opinion From Jim Sinclair…. One Of The Premier Authorities On Gold And Currencies!

    Posted By on April 7, 2010

    This presentation by Mr. Sinclair addresses what is currently going on in the world, including finances of course, which is his specialty. He is regarded as one of the premier authorities on gold and currencies in the world, and as such we should all value his opinion highly.

    1. Get a copy, if possible, of the BBC movie, “The Last Days of Lehman Brothers” it is exactly what occurred. They were flushed and allowed to go down. Those that did so made billions.

    2. The same people that sold Greece the products to hide the true condition of their finances ratted them out and are hugely short of Greek debt at this time.

    3. The more these people win at what they do, the more powerful they become.

    4. The failure of Lehman set off the bankruptcy(s) that allowed government money (your money) to flow to large institutions, who were the winners on the bet.

    5. The next phase of problems will come about because of a loss of confidence in currencies themselves.

    6. Regulators are totally ineffectual in dealing with what is occurring.

    7. If we have a failure of Greek debt it will be catastrophic and we all will pay. If Greece does not fail, we will have money printing (quantitative easing is the buzz word) to infinity.

    8. China is actively seeking control of the resources of the world, all JSMineset speculation on this has far exceeded what was postulated.

    9. With the incredible bonuses being paid to Wall Street executives, you have to know it is there last lick of the cone. They know profits are not real.

    10. To balance the US balance sheet, gold would have to go to insane numbers. The mechanism is in place to drive gold to incredible numbers.

    11. Credit default swaps are being used as the hammer to destroy nations. They are doing this by shorting sovereign debt, then using the media to bring about the profit of their position (ie calling nations PIIGS  this isn’t flattering and does not inspire confidence, causing people to stay away). The players doing this have no conscience, are oblivious to the side effects, are power crazed, and believe they are gods. Sovereign debt is the next bomb to implode.

    12. The only currency that will sustain what is coming is gold.

    13. We are headed for a one world currency with a central bank of central banks. The world is going to change dramatically in possibly as little as two months.

    14. The individual states in the US, which are bankrupt in many cases, will be attacked next. Big money is already hugely short of state debt. Ultimately this will take down the US dollar as well.

    15. A one world government is coming.

    16. Hyperinflation is a loss of confidence in paper currency.

    17. Gold is money without liability on the other side. It stands alone. Make your balance sheet as good as it can be.

    18. If Greece goes (is flushed and not bailed out), then the whole world changes, perhaps overnight. Look for 200 dollar swings in the gold price. Because the “dark side” (those who are in control of this) are smarter than you are, add to your positions in gold on reactions. Gold is an insurance policy.

    19. China will rule the world. Friends of China will benefit from that. China’s interest in Africa and its treasure chest of mineral wealth isn’t an accident.

    20. Yuan denominated paper, if one can get it, might be a place to be with some of your investment portfolio.

    21. Equity markets may in fact go up due to a Weimar effect. All that money created from nothing finds its way into the stock markets of the world.

    22. Stres simplicity in your personal life. Be focused, balanced, and go back to basics. This is not a time to get fancy.

    23. There will be no end to naked shorting by the players. The real game is destroying nations, countries (think Dubai, Iceland…)

    24. The flushing is in fact deliberate. If Greece does in fact go down, it will definitely be deliberate.

    25. Gold’s window is still open here because those that know what is coming are still accumulating. Expect it to be closed by year end. That means if you don’t have any, don’t expect to be able to get any.

    26. Hold any stocks you happen to own in certificate form in your hand, and don’t lose the certificate. If you are a stock player, check out true custodial accounts. Make certain that your holdings are in fact yours and NOT on the books of the bank.

    27. A question was asked: If I had a million Canadian dollars to invest right now, where might I put that?  The answer was 1/3 into gold bullion, held close, 1/3 in both Canadian Tbills and Swiss Franc’s, and the remaining 1/3 into what you do best.

    28. Major financial houses today are acting like countries. Greece does not control its destiny, it is in the hands of those houses which become stronger with each situation they take down.

    29. Expect mining company consolidations to greatly accelerate.

    30. The Canadian dollar is very much a wild card. It may rise nicely, because it and Canada generally have remained conservative as opposed to other far more leveraged approaches. Canada is currently sitting in the cat bird seat, and it’s not really helping Canada because of our export based economy.

    31. The number to watch on the Euro is 1.29 against the US dollar. Should it go lower, the Euro is in serious trouble.

    32. The US has no strength for geopolitical disruptions at this time. It’s a house of cards that could come down at any time.

    33. Keep it simple! Back to basics.!

    34. The Asian and the Polish crisis were precursors to taking down the Euro. If the Euro is torched, the pound and dollar are next. As a side note, Jim Rogers feels the British pound is months or possibly weeks away from being heavily attacked once again. This is my comment, not Jim Sinclair’s. Look for the pattern here.

    35. Money (the wealth of the world) has been concentrated into a very few hands. They are currently only interested in tearing down. There is no interest in creating, only destroying. China is building up. Algorithms (computer modeling and trading) are being used to destroy.

    36. Gold stocks should leverage 2 to 5 times a bullion position.

    www.jsmineset.com

    The Parachute Jump…..Can You Save This Daffy Duck

    Posted By on April 6, 2010

    This game takes some real skill……………….

     Click here: PARACHUTE JUMP


    How Long Will You Live?

    Posted By on April 6, 2010

    This is quite a test for us, especially if you answer truthfully !How long will you live?This is pretty interesting.

    Watch the age prediction on the top left of the screen change as you answer the various questions.

    http://media.nmfn.com/flash/longevity-game/game.html

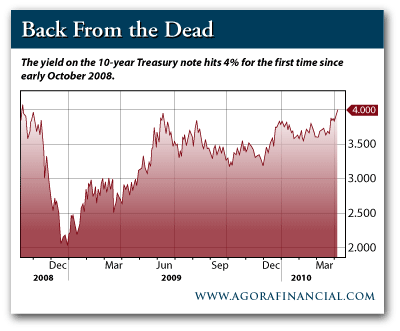
    Interest Rates Are Rising……….

    Posted By on April 6, 2010

    10 Year Treasury Yield

    Demographics Of The Aging United States Population

    Posted By on April 6, 2010

    Demographics?

    Let’s look at the “age pyramid” for the United States. The following 2 charts from the National Institutes of Health shows that the population is aging:

    This graphic (courtesy of Ed Stephan) shows the U.S. age pyramid from from 1950 through 2050:

    male female
    Population of the United State

     www.zerohedge.com

    Gold vs. The S&P 500

    Posted By on April 6, 2010

    Gold vs Stockmarket

    A DISCRETE BULL MARKET

    Gold’s major trend has been up for nine consecutive years, yet the investing public has barely begun to invest. It’s not well known that this bull market even exists. This in itself is bullish because it means the 375% gain over the last almost decade will be pale compared to the potential this second phase of the bull market could have.

    The markets are one big ball of mass emotions. And in many ways, the first nine years of the stock market’s mega bull market rise from the mid-1970s through the 1990s was similar to this bull market rise in gold.


    Chart 1 shows the S&P500 from the 1974 major low to the 2000 peak, compared to the gold market from its 2001 low to the present. Here you can see the similarities of the first nine years.

    In both cases, the rise wasn’t generally noticeable because another overpowering market was the main focus. In 1974-1983 the gold market was the flurry, not the stock market. Since 2001, it’s been the stock market flurry, which carried over from the tech and global boom, that has had more attention.

    This is not to say that gold today is where the stock market was in 1983, ready to embark upon a mega decade bull market, but it could. These similarities and many others suggest that gold’s bull market has much further to run.

    From The Aden Forecast

    A Grim Assessment Of The City Of Los Angeles Finances

    Posted By on April 5, 2010

    By Phil Willon and Maeve Reston

    April 5, 2010

    City Controller Wendy Greuel declares an ‘Urgent Financial Crisis’ and says the only way to continue paying bills in the short term is to begin draining the city’s already limited emergency reserve.


    The city’s top financial official issued a grim assessment of the escalating budget crisis Monday, warning that Los Angeles could be unable to pay its bills in just over four weeks.

    City Controller Wendy Greuel declared an “urgent financial crisis” and said the only way to continue paying bills in the short term was to begin to drain the city’s already limited emergency reserve.

    Gruel’s announcement was the latest development in an increasingly bitter standoff between the City Council and the city’s Department of Water and Power over how much the municipal utility should charge ratepayers and how much it should contribute to the city’s treasury.

    DWP officials have proposed rate increases that would range from roughly 9% for most users to as high as 28% for some. The council has blocked those increases, responding to irate reactions from constituents. DWP officials have said that without the extra money, they cannot meet their commitment to send the city an additional $73.5 million on which budget officials say they have been counting.

    Interim DWP General Manager S. David Freeman, in a letter sent to Greuel Monday morning, said that he would urge the utility’s board of commissioners — all appointees of Mayor Antonio Villaraigosa — to withhold the $73.5-million payment. Without the rate increase, he said, the DWP would not have “surplus revenue” to contribute to the city while still paying its own bills.

    Angry council members said they were skeptical of Freeman’s assertion and accused the giant agency — the nation’s largest municipal utility — of trying to use the payment to force through the rate increase.

    Greuel said the city would need to pull money from its $191 million in reserve funds immediately to pay its bills next month. She expects the city to be out of money, and probably in the red, by June 30.

    “This is the most urgent fiscal crisis that the city has faced in recent history, and it is imperative that you act now,” Greuel told the mayor and council members. “That is why I am asking you to immediately transfer $90 million from the city’s reserve fund to the general fund so I can continue to pay the city’s bills, and to ensure the fiscal solvency of the city.”

    Acting City Administrative Officer Ray Ciranna, the city’s top financial analyst, said that using the reserve funds, plus agency spending freezes and other savings could reap enough money to cover Los Angeles’ bills through the end of the fiscal year, June 30. Some officials fear that using that money would not only leave the city without reserves in case of emergencies, it would also probably trigger another downgrade in its Wall Street credit ratings.

    “We think we could probably cover the current year deficit without the $73 million. But it leaves us with no reserves, which is not good,” Ciranna said.

    “I think we have folks who are over in the DWP that are playing games with people’s lives,” said Councilman Bernard C. Parks, who heads the city’s budget committee.

    Parks continued to question assertions by DWP officials that the agency’s financial situation had deteriorated. In March, DWP officials assured the council that the utility would transfer a total of $220 million to the city’s general fund by June 30 — the utility has paid only $147 million thus far.

    Councilman Greig Smith said the city has few, if any, options to recoup the remaining money before July 1. Even additional layoffs could not be processed that quickly, in part because many employees are protected by a labor agreement through the end of the current fiscal year.

    “Our reserve fund was already very marginal to begin with; this could push it over the edge,” Smith said. “That would mean we would have nothing in the tank on June 30,” at the end of the fiscal year.

    The fight with the DWP escalated in late March, when the council rejected the Villaraigosa-backed plan to raise rates for households.

    When the proposal was first mentioned two months ago, Villaraigosa and his staff pitched it as an environmentally friendly initiative that would wean the DWP off dirtier coal. Weeks later, the mayor said the extra revenue also would help the utility cover rising coal costs and renewable energy contracts signed by his administration since 2005

    To address concerns about the utility’s fiscal health, the council approved a smaller electric rate increase of 4.5% last week and sent it back to the DWP board for approval.

    But instead of approving the council’s more modest rate increase, Villaraigosa’s appointees on the DWP board voted for a 5.7% increase over three months, which was swiftly vetoed late that night by the council.

    Just Exactly How Much Money Is A Trillion Dollars……..

    Posted By on April 5, 2010

    During the past fifteen months, the Fed purchased $1.25 Trillion in MBS, which represented 80% of the mortgage market. Prior to this program, mortgage rates were above 6%. Now that the Fed program has ended, it’s reasonable to assume that mortgage rates will rise back towards those levels.

    Just How Much Money is $1.25 Trillion?

    In today’s financial headlines – the word Trillion is often casually thrown around. So much so, that it’s easy to lose perspective on how much money this really represents. Picture a stack of $100 bills. It might surprise you to know that it only takes a stack four inches high to be worth $100,000. So $1,000,000 would be a stack of $100 bills 40 inches tall. How about a Billion? Well, you would have to stack $100 bills up to the top of the Empire State Building…twice…in order to reach a Billion. So to picture $1.25 Trillion represented by a stack of $100 bills – that stack would be 850 miles high. If you could turn that stack on its side and were able to drive alongside it, it would take you longer than 14 hours to reach the end. If you laid those $100 bills down side by side, they would travel around the world 50 times. We’re talking about a lot of money here.

    http://www.investorsinsight.com/

    Air Force To Launch Robotic Winged Space Plane

    Posted By on April 4, 2010

    • This undated image released by the U.S. Air Force shows the X-37B spacecraft. The Air Force is preparing to launch this robotic spacecraft that resemb
    • AP – This undated image released by the U.S. Air Force shows the X-37B spacecraft.

    By JOHN ANTCZAK,      Associated Press Writer John Antczak, Associated Press
     
    Sat April 3, 2010                    Posted April 4, 2010

    LOS ANGELES – After a decade of development, the Air Force this month plans to launch a robotic spacecraft resembling a small space shuttle to conduct technology tests in orbit and then glide home to a California runway.

    The ultimate purpose of the X-37B Orbital Test Vehicle and details about the craft, which has been passed between several government agencies, however, remain a mystery as it is prepared for launch April 19 from Cape Canaveral, Fla.

    Built by Boeing Co.’s Phantom Works, the 11,000-pound craft is 9 1/2 feet tall and just over 29 feet long, with a wingspan of less than 15 feet. It has two angled tail fins rather than a single vertical stabilizer.

    Unlike the shuttle, it will be launched like a satellite, housed in a fairing atop an expendable Atlas V rocket, and deploy solar panels to provide electrical power in orbit.

    The Air Force released only a general description of the mission objectives: testing of guidance, navigation, control, thermal protection and autonomous operation in orbit, re-entry and landing.

    The mission’s length was not released but the Air Force said the X-37B can stay in orbit for 270 days. The primary landing site will be northwest of Los Angeles at coastal Vandenberg Air Force Base.

    The significance of the X-37B is unclear because the program has been around for so long, said Peter A. Wilson, a senior defense research analyst for the RAND Corp. who several years ago served as executive director of a congressional panel that evaluated national security space launch requirements.

    “From my perspective it’s a little puzzling as to whether this is the beginning of a program or the end of one,” Wilson said Friday in a telephone interview from Washington, D.C.

    “It’s viewed as a prototype of a vehicle that could carry small payloads into orbit, carry out a variety of military missions and then return to Earth,” he said.

    The Air Force statement said the X-37 program is being used “to continue full-scale development” and orbital testing of a long-duration, reusable space vehicle.

    Wilson sees the upcoming launch as “a one-shot deal.”

    He acknowledged that he does not know if there is a classified portion of the program but said there is no evidence of a second vehicle being built to follow the prototype. In aerospace, a prototype typically remains a test vehicle used to prove and improve designs for successive operational vehicles.

    To fully function as a completely reusable launch system there would also have to be development of a booster rocket that is capable of landing itself back on Earth to be reassembled with the spacecraft, according to Wilson, who does not see any support for such an initiative.

    Wilson also said the usefulness of payloads such as small military satellites is in question, which would undercut the need for the launch system.

    The X-37B is now under the direction of the Air Force’s Rapid Capabilities Office. Its mission is to speed up development of combat-support systems and weapons systems.

    Operating since 2003, the office has worked on several things, including upgrading the air defenses around the nation’s capital as an anti-terrorism measure and assessing threats to U.S. combat operations, according to an Air Force fact sheet.

    NASA began the X-37 program in 1999 in a cooperative deal with Boeing to roughly split the $173 million cost of developing an experimental space plane. The Air Force put in a small share.

    The X-37, initially intended to be carried into space by shuttles in 2003, was a larger version of the Air Force X-40A, a concept for a “Space Maneuver Vehicle” to put small military satellites in orbit. The X-40A was dropped from a helicopter in glide and landing tests but was never capable of actual space flight.

    In 2002, NASA awarded Boeing a $301 million contract to complete a version of the X-37 to be used in approach and landing tests and begin designing an orbital version that would fly in 2006.

    But in 2004 NASA turned the project over to the Defense Advanced Research Projects Agency, the Defense Department’s research and development arm. In 2006, the X-37 was put through captive-carry and drop tests using Mojave-based Scaled Composite LLC’s White Knight, the jet that launched SpaceShipOne on the first private suborbital manned space flights.

    The Air Force then began work on the X-37B, projecting it would fly in 2008. An Air Force News story at the time reported that the first one or two flights would check out the performance of the vehicle itself and then it would become a space test platform with unspecified components flown in its experiment bay.

    Complete article at …………..http://news.yahoo.com/s/ap/20100403/ap_on_sc/us_mystery_spacecraft

    Rock And Roll…..Earthquake Upgraded To 7.2 In Baja Mexico And Southern California

    Posted By on April 4, 2010

     Recent Earthquakes in California and Nevada

    —> Please visit our reorganized earthquake pages at – http://quake.usgs.gov/ <—
    including new CA-NV pages at – http://quake.usgs.gov/recenteqs/latest.htm

    Click on an earthquake on the above map for more information.
    Click on an arrow at edge or corner of above map to go to an adjacent map.
    Click here to go to index map || big earthquake list || all earthquakes list
    Special maps: Long Valley || Los Angeles || San Francisco || Parkfield
    Map need updating? Try reloading the page to your browser.
    Maps are updated within about 5 minutes of an earthquake or once an hour.
    Brown lines represent known hazardous faults or fault zones. White lines are roads.
    What happens when I click on an earthquake?

    Update time = Sun Apr 4 17:43:34 PDT 2010
    Here are the 30 most recent earthquakes and all M>5 earthquakes on this map…
     

     3.5  2010/04/04 17:31:15 32.311N 115.456W 30.5   33 km (20 mi) W   of Guadalupe Victoria, Baja California, Mexico
     3.5  2010/04/04 17:30:01 32.572N 115.763W  3.6   25 km (16 mi) SSW of Seeley, CA
     3.3  2010/04/04 17:29:18 33.542N 115.703W  7.7   21 km (13 mi) N   of Bombay Beach, CA
     4.1  2010/04/04 17:22:12 32.456N 115.530W 27.5   23 km (14 mi) SSW of Mexicali, Baja California, Mexico
     3.7  2010/04/04 17:21:27 32.599N 115.742W  3.9   22 km (14 mi) SSW of Seeley, CA
     3.8  2010/04/04 17:20:13 32.475N 115.643W  0.1   26 km (16 mi) SW  of Mexicali, Baja California, Mexico
     4.1  2010/04/04 17:19:40 32.554N 115.102W  6.6   29 km (18 mi) N   of Guadalupe Victoria, Baja California, Mexico
     4.3  2010/04/04 17:12:23 32.577N 115.744W  0.0   24 km (15 mi) SSW of Seeley, CA
     3.7  2010/04/04 17:06:00 32.516N 115.713W  1.5   27 km (17 mi) SW  of Calexico, CA
     3.4  2010/04/04 17:04:51 32.684N 115.865W  1.5   14 km ( 9 mi) ESE of Ocotillo, CA
     3.1  2010/04/04 17:02:48 33.186N 115.873W  0.0   15 km ( 9 mi) SSE of Salton City, CA
     3.9  2010/04/04 16:57:13 32.590N 115.769W  0.0   24 km (15 mi) SSW of Seeley, CA
     3.6  2010/04/04 16:53:44 32.616N 115.796W  0.4   22 km (14 mi) SSW of Seeley, CA
     3.4  2010/04/04 16:49:55 33.446N 115.842W  0.1   13 km ( 8 mi) SE  of North Shore, CA
     3.4  2010/04/04 16:48:23 32.916N 115.401W 21.5   12 km ( 7 mi) N   of Holtville, CA
     3.5  2010/04/04 16:46:29 32.667N 115.795W  3.5   17 km (11 mi) SW  of Seeley, CA
     4.7  2010/04/04 16:37:32 32.468N 115.565W  0.8   22 km (14 mi) SSW of Mexicali, Baja California, Mexico
     4.3  2010/04/04 16:34:27 32.575N 115.717W 20.1   23 km (15 mi) WSW of Calexico, CA
     5.4  2010/04/04 16:25:09 32.122N 115.061W 10.0   19 km (12 mi) SSE of Guadalupe Victoria, Baja California, Mexico
     5.1  2010/04/04 16:15:20 32.839N 115.585W 16.9    1 km ( 1 mi) WSW of Imperial, CA
     4.8  2010/04/04 16:09:38 32.109N 115.329W  6.0   29 km (18 mi) SW  of Guadalupe Victoria, Baja California, Mexico
     7.2  2010/04/04 15:40:40 32.128N 115.303W 10.0   26 km (16 mi) SW  of Guadalupe Victoria, Baja California, Mexico
     3.3  2010/04/04 15:34:48 32.184N 115.287W  0.2   20 km (13 mi) SW  of Guadalupe Victoria, Baja California, Mexico
     2.1  2010/04/04 07:02:48 32.566N 115.790W  9.3   27 km (17 mi) SSW of Seeley, CA
     2.3  2010/04/04 03:44:53 32.599N 115.313W 30.5   16 km (10 mi) ESE of Mexicali, Baja California, Mexico
     3.4  2010/04/04 02:36:25 32.227N 115.276W  4.1   17 km (11 mi) WSW of Guadalupe Victoria, Baja California, Mexico
     3.2  2010/04/04 00:51:35 32.137N 115.314W  0.2   26 km (16 mi) SW  of Guadalupe Victoria, Baja California, Mexico
     3.3  2010/04/03 22:05:07 32.137N 115.318W  0.1   26 km (16 mi) SW  of Guadalupe Victoria, Baja California, Mexico
     1.5  2010/04/03 21:48:33 33.729N 115.938W  6.8   21 km (13 mi) NE  of Mecca, CA
     4.3  2010/04/03 16:03:47 32.249N 115.328W  8.2   21 km (13 mi) WSW of Guadalupe Victoria, Baja California, Mexico

    Click here to see this same map………….

     http://quake.wr.usgs.gov/recenteqs/Maps/115-33_full.html

     MAG    DATE    LOCAL-TIME  LAT     LON    DEPTH    LOCATION
            y/m/d     h:m:s     deg     deg     km

    John Mauldin………Is This a Recovery?

    Posted By on April 3, 2010

    Is This a Recovery?

    First, we are in a nascent recovery from the depths of the Great Recession, but the question is “what kind of recovery?” Many suggest that we will see a typical recovery, like we have seen with every recession since World War II. As regular readers know, I don’t think we’ve gone through a typical, garden-variety recession, and to expect a typical recovery is more faith-based than factual. We had a deleveraging recession and we are still deleveraging. The process, as shown in studies I have written about, takes years to conclude.

    When I started talking in 2002 about a Muddle Through Economy for the rest of the decade, I had a lot of people giving me a hard time by 2005-6. But as we closed out the decade, average growth of US GDP for the entire decade was less than 2% annualized, which by my definition is Muddle Through. For the US economic machine, that was pretty anemic growth. It resulted in a lost decade for stocks, except for the NASDAQ, for which it was merely a dismal decade. Traditional 60-40 (stocks to bonds) portfolios did not fare well, coming nowhere close to the projections of standard-issue money managers.

    I think we are in for yet another Muddle Through period, at least for 5-7 years and maybe for the decade, depending on a few scenarios I will come to in a minute. As my friend Prieur du Plessis outlined for us in last Monday’s Outside the Box, if we measure the stock market by either earnings or dividend yields, valuations are in the top 10% historically. Average (!) returns, going out for ten years, are 2.6% real, with some historical 10-year periods being negative. Below is the range of returns, based on dividend yields. It does not look much different from the chart based on earnings. We are currently at the far right-hand bar.

    image001

    This does not suggest a happy outcome for those who espouse buy-and-hope portfolios, at least not if you have expectations or needs of 7-8% or more.

    This Time is Different

    If you are a new reader, I suggest going to the archives at http://www.2000wave.com/archive.asp and searching on the name “Rogoff,” to read the letters I have written on his and Carmen Reinhart’s must-read book, This Time is Different, which shows us that it is never different this time. They looked at 266 financial crises in over 60 countries across a span of 200 years.

    Debt crises have sadly similar conclusions: they always end in pain and tears. And although we have stopped, as private citizens, from accumulating debt (or in some cases, such as mortgages, have just walked away from the debt), our national government has stepped into the breach and is borrowing at mind-boggling levels.

    Below is a chart that is a wonderful illustration of an economic truth: if something can’t happen then it won’t happen. We cannot borrow $15 trillion in the next ten years. Not at anywhere near the low interest rates we enjoy today, and probably not even at nosebleed rates. (Note that the chart was created before the health-care reform bill. Add at least another trillion to the total. Anyone who thinks that bill was revenue neutral is kidding themselves.)

    image002

    The End Game

    Something has to change. We have two paths to choose from. We can either slowly bring the US budget deficit back into balance (or at least to a level less than the growth in nominal GDP) or we can continue on the current path and become Greece or Japan. (Again, go the archives and search for “Japanese Disease”.)

    The first choice is a bad one, but the latter choice would be disastrous. If we take the first choice, which I call the Glide Path Option, a meaningful reduction would have to be on the order of $200-250 billion a year. That, along with reduced spending by state and local governments could (and probably will) amount to reducing spending by a little more than 2% of GDP.

    I have written several letters on the equation GDP = C (consumer and business consumption) + I (investments) + G (government spending) + E (net exports) (again, searchable). The Keynesians point out that when “C” is reduced in a recession, “G” should be increased to offset the effects of reduced consumption. And they are correct that a deficit will help overall GDP in the short run.

    But we are coming to the end of the Debt Supercycle. There are limits to what even the US government can borrow, and the sooner we recognize that as a nation the better off we will be in the long run.

    But if we start to reduce our deficits (the “G”), it will be a short-term drag on GDP. There is no way around it. That means that if inflation is 2% and we have a reduction in “G” of 2% of GDP, then the nominal growth in GDP will have to be 6% in order to achieve after-inflation growth of 2%. Two percent as in Muddle Through.

    But wait, John, didn’t we just grow at 5.6% last quarter? Why are you being so gloomy? For several reasons. First, the growth was largely statistical. Part of it came from inventory accounting, as inventories had got as low as they could go. Note that an increase in inventories will increase GDP but possibly result in a lower future GDP as the excess inventory is depleted. And inventories are still rising, but not by as much.

    Secondly, a significant portion of the increase in GDP came from the stimulus. As noted above, an increase in “G” will be reflected in current GDP. This stimulus begins to go away in the second half of the year, and I think there is little reason to believe there will be anything other than an extension of unemployment benefits past two years, by way of “stimulus” this year.

    I rather think the last half of the year will show a slowing (though still positive) economy. Unemployment will be closer to 10% than 9% at the end of the year, as the large number of temporary census workers will no longer be employed by the government.

    Some Good News on Unemployment

    The good news is that employment rose by 162,000 jobs last month, with about 48,000 of those being census workers and another 82,000 coming from the birth/death ratio, a way of guessing how many new businesses are started. The birth/death ratio is eventually squared up when we get real statistics, but it will be several years before we know the true picture. So, while the headline is good, the reality is not quite as good. But let’s take what we can. The direction is positive, and it should get better over time.

    Small businesses have at least stopped laying people off, according to my friend Bill Dunkenberg, chief economist of the National Federation of Independent Business. The improvement is due to fewer reductions in jobs, not gains in new hiring.

    image003

    There are not a lot of job openings, according to the survey that goes along with this note from The Liscio Report: “The probability of a person unemployed in February finding a job in March fell to from 20.1% to 18.7%, an all-time low for this series (which goes back to 1948).

    This reenforces a letter I wrote last November, talking about the prospects for longer-term employment rates. Even the rosy scenarios still have unemployment above 8% in four years. That assumes a total of 1.5 million new jobs can be created this year and two million every year thereafter, with no recession.

    image004

    Remember, we need about 125,000 new jobs a month to just keep up with the growth in our population. Though if you look at today’s employment release, they added a whopping 398,000 people to the civilian labor force (a huge number when compared to the 162,000 new jobs – a discrepancy you didn’t read about in any report.). What kept the unemployment rate from rising significantly was that they deducted 238,000 people who are no longer considered unemployed, due to the fact that they have given up looking for jobs. The U-6 unemployment rate rose to 16.0%, however. The U-6 rate includes people who have part-time work but wish they had full-time work. That part-time number rose above 9 million again this month, in a rather large monthly jump.

    You can read the whole November letter and see the other two scenarios.

    The Effects of a Tax Increase

    I have written about the effects of tax increases in several letters. Basically, tax increases have a negative impact on GDP of three times the size of the tax increase. (Again, in the archives, search for “Romer”, as in Christina Romer, Obama’s head of the Joint Council of Economic Advisors and co-author with her husband of the research).

    Taxes may be going up by as much as 2% of GDP in 2011, when you include state and local increases. This could be as much as a 6% drag on GDP over the next three years (probably somewhat front-loaded).

    So, let’s add it up. We will likely see a reduction in government spending (from all levels) over the next few years, a really nasty set of tax increases, which will hit small businessmen the hardest, and continued high unemployment, and all of it coming in a weakening economy by the end of the year.

    I put the odds of a double-dip recession in 2011 at better than 50-50. Not a sure thing, as maybe sanity flowers and they phase in the tax increases over 3-4 years. Plus, the American economy and businesses are more resilient than we think, and it is possible we Muddle Through 2011. Not much growth, but perhaps we avoid that recession.

    Deflation in the US is the dominant force. There is little likelihood today of a worrisome increase in inflation. I have written letters about why this is the case. (Search for “elements of deflation” and “velocity”). Actually a little inflation (2-3%) might be welcome as a protection against slipping into outright deflation, if we slow down next year.

    Let’s try to sum it up. We have a Muddle Through Economy this year (not much more than 2% overall growth for the year), with a slowing economy next year. Unemployment stays high. If we get our deficits under control, we lock in a slow-growth economy for 5-6 years, but after that we could get back on track. A recession puts that brighter outlook out a little farther. Unemployment would go north of 12%. I might note that the stock market drops an average of 40% during a recession.

    Or we do not get our deficits under control. We can go on borrowing for a lot longer than most of us think. But the Rogoff and Reinhart book makes clear that there is an end. You can’t solve a debt crisis with more debt. Ask Greece in about 6-12 months, as the “fixes” are temporary. Things go along until there is a loss of confidence in the bond market, and then all hell breaks loose. When is that? Who knows? But it is not ten years away, and probably not five. Rates skyrocket and the currency takes a hit.

    And then we are presented with a conundrum. Would the Fed really enable the government to run huge deficits by monetizing the debt? It would be a crisis decision. If they just stand by, interest rates soar and the economy goes into recession or worse. If they print, we could see inflation and a crashing dollar, with rates soaring. As I said above, this would be a disastrous scenario. I think we avoid it, as there will be a growing backlash at the polls against government deficits. But then I am an optimist. If you think the politicians cannot muster the will to make the cuts, then bet on the disaster scenario. Think gold and hard assets and foreign assets and absolute-return funds.

    But optimist though I am, I can’t rule out disaster. So, either we have a slow-growth economy for 5-6 years, or we hit the wall all at once. Think depression if it’s the latter. Either way, it’s a tough investment environment.

    So, how about those with a 10-year time frame, like the reader I opened with? First, lengthen your time frame. There are some amazing new medical therapies coming your way and you are likely to live longer. I would plan on it. You will need more than you think you will.

    Second, really think about your commitment to equities in general. By that I mean the usual index funds. If you have (or your manager has) some real skill in picking stocks, then that is different. But I think it is very possible we’ll see another lost decade for stocks in the US. If we do have a recession next year, the world markets are likely to fall in sympathy with ours. At the bottom, it is quite possible that emerging-market stocks will finally decouple from the developed world, so for those who should be in stocks (those with a longer time horizon), think about going beyond the developed world.

    For most of you, caution is appropriate. Do not plan to make 8% a year from your portfolio, or to spend 7% of your savings. As Ed Easterling has shown, there are historical periods where people taking 5% a year from their portfolios would be left with nothing after 30 years. In fact, about 50% of those portfolios would run out of money in an average of just over 20 years. The key? Starting valuations. http://www.crestmontresearch.com/pdfs/Stock%20Retirement%20SWR.pdf

    For most people already retired, a fixed-income portfolio should be your first choice. High-quality corporate bonds, high-quality state and municipal bonds (do your homework – don’t trust the rating agencies!), and a “ladder” of not not more than 4 years. I know that does not yield much, but you should be protecting your principal.

    If you have enough income from a portion of your assets to live on, then think about absolute-return-type funds.

    Ken, if your time horizon really is ten years, then safety should be your number-one objective.

    Also, I know some people are managing their wealth for the next generation. That may make my note of caution not as emphatic, assuming you really do have enough to make your expected time horizon and more.

    All that being said, I am still bullish about certain businesses. As I noted a few weeks ago, I see an opportunity in bleeding-edge software consulting for media and other businesses that have to innovate or die, and I’m investing in such a startup. I am also investing in small-cap biotech stocks, with a 10-year horizon. Remember that birth/death ratio? While I do not believe it is as high as they estimate, there are businesses being started all over the country. That is what a free market does.

    If I had the stomach to deal with renters, I would be buying distressed homes at prices where I could more than make a reasonable return. For some of you, that may be a way to get income. (Commercial real estate will soon become a real potential as well, for experienced investors.)

    The US economy is not coming to an end. There will be lots of opportunities, but it will be harder than in the past. More like swimming through peanut butter. But nothing is ever easy. For the next few years, I simply think being more cautious makes sense – but choose your targets. There are funds and managers I like.

    A 10-year time frame? There is not much I can say that will make you happy. 20 years? That should be another thing. One way or another, this deficit crisis will resolve itself, and then we can get back to doing what we do best.

    John Mauldin
    John@FrontLineThoughts.com

    Copyright 2010 John Mauldin. All Rights Reserved

    Note: The generic Accredited Investor E-letters are not an offering for any investment. It represents only the opinions of John Mauldin and Millennium Wave Investments. It is intended solely for accredited investors who have registered with Millennium Wave Investments and Altegris Investments at www.accreditedinvestor.ws or directly related websites and have been so registered for no less than 30 days. The Accredited Investor E-Letter is provided on a confidential basis, and subscribers to the Accredited Investor E-Letter are not to send this letter to anyone other than their professional investment counselors. Investors should discuss any investment with their personal investment counsel. John Mauldin is the President of Millennium Wave Advisors, LLC (MWA), which is an investment advisory firm registered with multiple states. John Mauldin is a registered representative of Millennium Wave Securities, LLC, (MWS), an FINRA registered broker-dealer. MWS is also a Commodity Pool Operator (CPO) and a Commodity Trading Advisor (CTA) registered with the CFTC, as well as an Introducing Broker (IB). Millennium Wave Investments is a dba of MWA LLC and MWS LLC. Millennium Wave Investments cooperates in the consulting on and marketing of private investment offerings with other independent firms such as Altegris Investments; Absolute Return Partners, LLP; Fynn Capital; Nicola Wealth Management; and Plexus Asset Management. Funds recommended by Mauldin may pay a portion of their fees to these independent firms, who will share 1/3 of those fees with MWS and thus with Mauldin. Any views expressed herein are provided for information purposes only and should not be construed in any way as an offer, an endorsement, or inducement to invest with any CTA, fund, or program mentioned here or elsewhere. Before seeking any advisor’s services or making an investment in a fund, investors must read and examine thoroughly the respective disclosure document or offering memorandum. Since these firms and Mauldin receive fees from the funds they recommend/market, they only recommend/market products with which they have been able to negotiate fee arrangements.

    Send to a Friend | Print Article | View as PDF | Permissions/Reprints

    You have permission to publish this article electronically or in print as long as the following is included:

    John Mauldin, Best-Selling author and recognized financial expert, is also editor of the free Thoughts From the Frontline that goes to over 1 million readers each week. For more information on John or his FREE weekly economic letter go to: http://www.frontlinethoughts.com/learnmore

    Domestic Equity Fund Flows….. $3.5 Billion In Outflows Year To Date

    Posted By on April 1, 2010

     $3.5  Billion In Outflows Year To Date

    Equity Outflows

    The broader public, where the first baby boomers begin retiring this year, continues rotating out of equities and into the safety of bonds. The ICI just disclosed that fund flows for domestic equity mutual funds turned negative for the week of March 24 to the tune of almost $1 billion, after a substantial spike the week before. This occurred even as the market has barely had a single down day in the past two months. Year To Date the outflows have now hit a massive $3.5 billion, surprising when considering the performance of the actual stock market, which continues being bid up into the stratosphere by Primary Dealers, or as Rosenberg affectionately calls them, Pig Farmers, using free Fed money, as they merely trade with nobody but each other in a disappearing volume game of musical chairs in which each and everyone is just focused on the exit strategy and getting the market to a sufficiently high level where a 30% “bidless” drop doesn’t destroy too many.

     www.zerohedge.com

    State And Local Tax Revenues Tumble, Then Rebound Small

    Posted By on March 31, 2010

    From The Wall Street Journal:

    At the root of governments’ problems today are promises made in past decades. As a group, state and local governments have promised an estimated $3.35 trillion in pension and health-care benefits to be paid over the next three decades, but are estimated to have 70% of the money to cover those payments, according to the Pew Center on the States. Pension and health costs can consume 20% of city and state budgets.

    [UNIONS]

    California offers a view of the fallout. The state’s largest pension fund, the California Public Employees’ Retirement System, known as Calpers, is estimated to be only 57% to 65% funded. Having suffered investment losses in recent years, the state has had to dip deeper into its revenues to make up the funding gap. Last year, a budget impasse forced the state to issue IOUs for taxpayer refunds.

    It wasn’t long ago that California was going the other way, based on a different set of assumptions. In 1999, the state’s Democratic-controlled legislature and then-governor Gray Davis passed a law expanding benefits for many state employees. A proposal prepared by Calpers—the $200 billion fund that manages money for 1.6 million of the state’s employees, retirees and their beneficiaries—forecast that the boosted benefits would be paid for entirely by investment gains. “There are only two ways you can have this problem: One, the promised benefits are too big, or two, not enough money was put away,” says David Crane, special adviser for Gov. Arnold Schwarzenegger.

    California’s contribution to its public-employee pension fund is projected at $3.5 billion in the fiscal year starting July 2010, 4% of the state’s general-fund budget, the highest proportion in state history.

    The Great Benefits Gap

    Posted By on March 31, 2010

     
    [UNIONSjump]

    From The Wall Street Journal……………….

    Many private-company workers have seen their retirement accounts shrivel, while public-sector benefits have been relatively unscathed. Defined-contribution plans such as 401(k)s had $3.33 trillion in assets at the end of 2009, down 4% from $3.48 trillion in 2006, according to the Federal Reserve. Such accounts have lost value even though companies and workers contributed $100 billion over that period.

    The rise in public-sector benefits has attracted the ire of citizens like Paul Nelson, a semi-retired investor in Upper Saddle River, N.J. Mr. Nelson, 59 years old, has a son at Northern Highlands Regional High School, where the principal says the school may have to cut teachers and increase class size. “Most public employees have retirement and health-care plans that private-sector employees can only dream of,” says Mr. Nelson.

    Virtually all full-time state- and local-government employees have access to retirement plans, and most are employer-funded.

    Historical Corralation Of Daily Returns (5 Years)

    Posted By on March 31, 2010

    Daily Returns

    Philly Fed Data

    Posted By on March 30, 2010

    Philly Fed Data

    www.ingerletter.com

    Average Monthly % Change For The Dow Jones Industrial Average: Last 50 Years

    Posted By on March 30, 2010

    Dow Average Change Last 50 Years

    www.ingerletter.com

    Tax Receipts Rebound, But………..

    Posted By on March 30, 2010


    By Dunstan McNichol

    March 30 (Bloomberg) — The two-year slide in tax collections that opened a $196 billion gap in U.S. state budgets has stopped, easing pressure on credit ratings and giving leeway to lawmakers as they craft spending plans for next year.

    The 15 largest states by population forecast a 3.9 percent gain in tax revenue in fiscal 2011, budget documents show. The 50 states on average may increase collections by about 3.5 percent, the first time in two years the figure is expected to grow, said Mark Zandi, chief economist at Moody’s Economy.com,

    California took in 3.9 percent more since December than projected in January, Controller John Chiang said this month. New York got $129 million above forecasts in its budget year through February, according to a report from Comptroller Thomas DiNapoli. In New Jersey, the second-wealthiest state per capita, January sales-tax collections were 1.9 percent higher than a year earlier, the first annual increase in 19 months, forecasters said in a report last month.

    “This time last year, we were sliding down a mountain, said David Rosen, chief budget officer for the New Jersey Legislature. I don’t think we are now; it’s stabilized.

    States collected about $79 billion less in sales, income and corporate taxes in 2009 than in 2008, the U.S. Census Bureau said today in a report, as the economy struggled through its deepest slump since the Great Depression. Emergency spending cuts and tax increases became routine during the recession that began in December 2007.

    more…..http://www.bloomberg.com/apps/news?pid=newsarchive&sid=aKBVswcpwXBE


    But………………


    Downtown NYC Towers Sit Empty

    Posted By on March 30, 2010

    By David M. Levitt

    March 30 (Bloomberg) — Downtown Manhattan, where demand for office space began to surge three years after the 9/11 terrorist attacks, is about to lose its spot as the best- performing U.S. market.

    Vacancies may exceed 14 percent of the area’s 87 million square feet by late 2011, empty space that’s equivalent to four Empire State Buildings and the highest rate since 1997, according to property broker Cushman & Wakefield Inc. That doesn’t include the 4.4 million square feet of offices in two towers now under construction at the World Trade Center site. Those are scheduled for completion in 2013.

    “The amount of space that’s potentially going to come to the market will increase availabilities and put pressure on pricing,” said Kenneth McCarthy, Cushman’s head of New York- area research. “It will be quite awhile before it can be absorbed.”

    Lower Manhattan, dominated by financial firms, withstood the commercial property slump better than any other U.S. business district, with more than 90 percent of offices occupied at the end of last year even as the city lost 67,500 jobs in the 12 months through December. Now open space is rising faster than demand, as Goldman Sachs Group Inc. moves into its new downtown building, American International Group Inc. relocates its headquarters, and Bank of America Corp. shifts operations to its new tower in Midtown.

    More at…http://www.bloomberg.com/apps/news?pid=20601109&sid=a3NKXZe6aJPE&pos=11

    It’s All Turned Around Like Our Economy!

    Posted By on March 29, 2010

    All Turned Around

    Copyright © 2025 The Stated Truth