The New Normal: Social Security As We Know It Will Have To Change

Posted By on September 18, 2010

The End of Social Security As We Know It


By Ian Mathias
Baltimore, Maryland

On September 30, America will quietly begin a generational shift. This will be the final day of the government’s fiscal year 2010, and consequentially, a very notable day for Social Security. September 30 will be the last day – maybe for a long time – that Social Security could possibly be operating at a surplus.

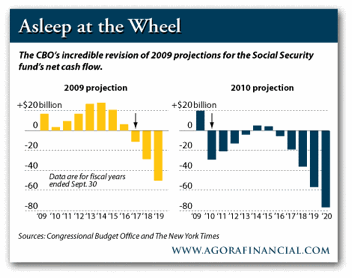
Back in March, the Congressional Budget Office (CBO) admitted that most Social Security funding projections were way off, and that sometime in 2010 the program would begin paying out more than it’s taking in. In August, the Social Security Board of Trustees said much of the same, that they too were drastically revising previous solvency projections. Just a year ago, both agencies forecast that the Social Security Trust Fund would stay out of the red until 2016. This year, they said 2010… As in, it’s probably already happened.

According to this year’s FICA/SECA tax receipts and benefit payouts, there’s reason to believe the SS fund dipped into deficit as early as February 2010. But since there’s no “official” government mandated date for when Social Security officially entered the red (we wonder if either agency actually knows) the end of the fiscal year will have to do, for now.

Though there will be some debate over when SS started losing money in 2010, there will be no such discussion in 2011, or the year after, or the year after that…or maybe ever again. Despite 2009 projections completely to the contrary, the CBO and Social Security Trustees now expect the fund to suffer deficits indefinitely. There may be two or three years of surplus if the US economy can avoid a double dip recession, but over the long term, in the words of the SS Board of Trustees, “program costs will permanently exceed revenues.”

CBO Revised Social Security Predictions

(Quick aside: That is one ugly revision. There’s nothing wrong with changing your mind, but someone at the CBO had quite an awakening in 2010.)

In summary of the CBO’s findings, the credit crunch and subsequent “Great Correction” moved a future Social Security crisis into the present tense. In fact, the whole issue is now worse. Stock market crashes and unemployment plights like those we’ve suffered lately have long term, arguably irreversible effects on wages, income inequalities, retirement plans and tax revenues…all of which will pile on top of Social Security at a time when it’s already bearing a heavy load.

But as you might remember, we’ve been here before. A not-so-dissimilar bout of high unemployment and lousy economic growth in the ’70s brought the Social Security fund to a sudden crisis in the early ’80s. By 1982, the powers that be weren’t just fretting over the program entering deficit…they had every reason to believe the Social Security would be out of money in as little as a year.

The Regan Administration’s solution was a bi-partisan study group called The National Commission on Social Security Reform (NCSSR). To lead the commission, Washington hired a man who has since proven to be one of the most unsuccessful monetary and fiscal planners in American history: Alan Greenspan.

Long story short, the Greenspan Commission marked “the end of Social Security as we know it”… or at least as we knew it in 1983. That year the Commission released its findings and recommendations, most of which were gradually implemented over the next decade. Here are some of the basic elements of their reform:

  • Social Security tax rates (including Medicare taxes) rose from 9.35% in 1983 to over 15% by 1990.
  • The minimum age to file for full benefits was slowly raised from 65 to 67.
  • The cost of living adjustment (COLA) was re-engineered to track growth in wages or inflation, whichever is lower. Previously, COLA just rose with inflation.
  • The taxable wage base rose dramatically. In 1983, all individual income over $32,400 was not subject to Social Security taxation. Today that base level is $106,800.
  • Greenspan’s plan offered Social Security coverage (and colluded participation) for most tax-exempt and federal employees that were previously excluded.

Essentially, Greenspan’s fix for Social Security was to take in more money and pay less of it out at a later date. And with the help of a booming American economy through most of the ’80s and ’90s, it worked… until it didn’t. As noted above, we’re just about back to square one.

(The real irony here is that there’s reason to believe there was nothing long-term about Greenspan’s solution in the first place. The Greenspan commission was formed by President Regan’s chief of staff Jim Baker, and it’s an open secret Baker’s key objective was only to make Social Security a non-issue for the 1984 election. As with most administrations, the real crisis was left for the next guy to deal with.)

The current generation of leadership is now “that guy.” Worse yet, this Social Security crisis is larger than the one we faced in 1982, which was a combination of a cyclical economic downturn and SS rules and mechanisms in need of reform. Today we face a structural crisis…they’re called baby boomers.

76 million Americans were born between 1946-1964, the so-called baby boomers. On January 1, 2011, the oldest member of this demographic – the largest America has ever known – will turn 65. At present they make up about a third of the entire US workforce. Taking their place will be Generation X, about 46 million people strong. Forgive us for the back-of-the-envelope math, but that sounds like 30 million fewer contributors to the Social Security fund and tens of millions of new beneficiaries. Hmmm…

When the whole idea of Social Security was first brought to the table, way back in post-Depression FDR days, there were 16 Social Security contributors for every 1 Social Security beneficiary. Today, that ratio is closer to 4:1. By 2030, when America will be bearing the full brunt of retired baby boomers, that ratio will be 2:1. To accommodate that ratio, either recipients will have to get less, or workers will have to pay more. The current method of funding the program is simply no longer applicable.

And there’s a whole other “problem” with current or soon-to-be Social Security beneficiaries: They’ll likely live much longer (and expensive) lives than their parents. In 1935 the average life expectancy was 65, making the minimum age to collect SS almost a cruelly ironic death sentence. Today, the average American will live to around 77… yet the minimum age to collect full benefits has only risen by 2 years. And if you believe tech-savvy people like my colleague Patrick Cox, we are on the verge of generational medical breakthroughs that could expand our life expectancies into the triple digits.

So what happens when the largest demographic America has ever known taps into a fund already in deficit? And what will we do if they…well…won’t die on time?

You can whine about “paying into Social Security every month for the last 40 years and I deserve every penny” till the cows come home… But this is simple, cold math. If you’ve been in the working world that long, you must understand by now the difference between what’s fair and what’s reality. The reality of the moment is this: You must…

  • Prepare to pay more Social Security taxes
  • Prepare to receive less Social Security benefits

As it stands today, there’s just not enough money to fund the Social Security program as we know it. With $2.5 trillion left in the SS warchest, there is no immediate threat to the status quo. But as the SS Board of Trustees forecast in August, “Over [a] 75-year period, the Trust Funds would require additional revenue equivalent to $5.4 trillion in present value dollars to pay all scheduled benefits.” That gap will be filled by borrowing from abroad, taxing at home or slashing the benefits of those yet to retire. Either way, it’s hard to picture a happy ending for Social Security. It’s in your best interest to build a substantial retirement fund of your own and – probably more importantly – one for your children.

Ian Mathias
for The Daily Reckoning

Personal Consumption Expenditures Are Still To High

Posted By on September 18, 2010

Gary Shilling

In terms of spending and saving, note that whatever has been going on in the consumer arena has been supported by massive federal stimuli. Those stimuli may persist at near current levels in future years due to chronic high unemployment, as noted in earlier Insights, but seems unlikely to rise at the rates they did since the recession began due to their effects on the already massive federal deficits. Republicans and even some Democrats in Congress are so worried about the mushrooming deficit that current stimuli is unlikely to be renewed at least until unemployment leaps further. In that case, the resulting withdrawal of support for consumer outlays may push them down. So the leap in consumer spending as a share of personal income (Chart 7 ), which has been propelled by tax cuts that were only partially offset by saving increases, is highly unlikely to persist.

jm091710image007

Taken from:  www.frontlinethoughts.com

The Consumer Goes On Strike

Posted By on September 18, 2010

By Gary Shilling

Consumers Go On Strike

It wasn’t until late 2008 that we had the collapse in home equity as house prices nosedived (Chart 2), rising layoffs (Chart 3) and the drying up of consumer lending drove consumers into retrenchment. But they suddenly went on a buyers strike in the last four months of 2008, and the results were leaps in inventory-sales ratios. Consequently, the cuts in inventories to get rid of unwanted stocks were far and away the biggest in the post-World War II era.

jm091710image002

Also, consumers are no longer saving less and borrowing more on credit card, home equity and other loans to bridge the gap between income and desired spending growth.  Furthermore, home equity has evaporated (Chart 6 ) and tight lending standards on credit card and other loans prevail. So they’re on a saving spree and debt reduction binge, further slashing the outlook for consumer spending, the third cylinder that normally fires to propel economic recovery from recessions.

                    Homeowners equity is at an all time low……

 jm091710image006

Meanwhile, commercial real estate high vacancies and severe financial problems will take years to resolve, keeping prices depressed for some time (Chart 9 ). So, all things considered, local government property taxes are likely to be curtailed for many years. Meanwhile, municipal expenses will be hard to cut. Chronic high unemployment will spawn high Medicaid enrollment and costs. Welfare and unemployment benefit costs will no doubt rise as well.

jm091710image009

Deteriorating finances are raising the risks of defaults on state and local obligations and even municipal bankruptcies. Harrisburg, Pennsylvania’s capital, will not make a $3.3 million municipal bond payment on $51.5 million debt that’s due in two weeks, and earlier this year, city officials discussed bankruptcy. Harrisburg also lacks the funds to continue payments for the $288 million debt on an incinerator project. Earlier, Jefferson County, Ala., home of Birmingham, defaulted on $227 million due on its disastrous sewer upgrades.

From www.frontlinethoughts.com

Pension Problems Growing Larger By The Year

Posted By on September 17, 2010

The median expected investment return for more than 100 U.S. public pension plans surveyed by the National Association of State Retirement Administrators remains 8%, the same level as in 2001   “It’s unrealistic,”  according to John Bogle, founder of mutual fund giant Vanguard.  He says the return assumptions in place at most pension plans can’t be meet.

The concern is that the reluctance to plan for smaller gains will understate the scale of the potential time bomb facing America’s government and corporate pension plans.

Pension funds at companies in the S&P 500 faced a $260 billion shortfall at the end of 2009, according to Standard & Poor’s. Estimates of the fund deficits faced by state and local governments range from $500 billion to $1 trillion.

Some plans are beginning to trim their return forecasts.  Earlier this month, New York State Comptroller Thomas DiNapoli said he would reduce the expected rate of investment return for his state’s pension system, the third-largest in the nation, to 7.5%, from 8%.

[pensionp1]

The country’s two biggest plans—the California Public Employees Retirement System, or Calpers, and the California State Teachers’ Retirement System, or CalSTRS—both are undergoing reviews of projected investment returns that could lead to reductions later this year.

Many plans have held onto an 8% return expectation though thick and thin. Such return assumptions partly reflect the heady years of the 1990s bull market. Public pension plans posted a median, annualized return of 9.3% over the past 25 years, but just 3.9% over the past 10, according to consulting firm Callan Associates.

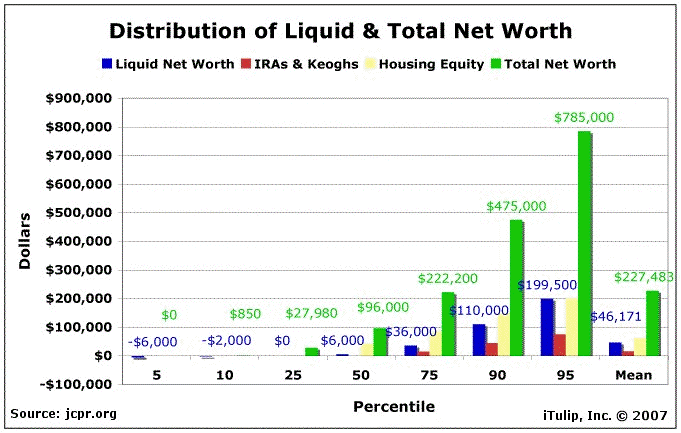
Now let’s look at the average value of a retirement plan, IRA, or Keogh in America…….the 90 percentile has less then $50,000 in retirement, and around $80,000 puts one in the 95 percentile and that’s as of the end of 2007, but the average loss going forward from that point is 18% through the 1st quarter of 2010.

Best Commodity Bet? Goldman Sees A Clear Winner

Posted By on September 17, 2010

By Bloomberg News

September 17, 2010

The best returns in commodities over the next 12 months will probably be in energy and the biggest losses in agriculture, Goldman Sachs Group Inc. said.

The bank is forecasting a 27 percent advance in energy over 12 months, a 17 percent jump in precious metals and a 15 percent gain in industrial metals, analysts led by London-based Jeffrey Currie said in a report today. Agriculture will decline 10 percent, the team forecast.

California Jobless Rate Climbed To 12.4% In August

Posted By on September 17, 2010

What happened to the recovery everyone was talking about a few months ago?  Inquiring minds want to know!

California’s unemployment rate rose to a three-month high of 12.4 percent in August as non-farm payrolls lost 33,500 jobs, the California Employment Development Department said.

The jobless rate increased from 12.3 percent in July, the department said today in a statement. In August 2009, unemployment stood at 12 percent.

“The labor force is getting softer, partly because of expiring benefits and a weak job environment,” Dennis Meyers, principal economist in the state Finance Department, said today in a telephone interview. “The weak job environment discourages people from looking and tends to contract the labor force.”

The California unemployment rate surpassed the national level as the longest recession since the Great Depression continues to hammer the state. In July, California had the third-highest jobless rate among U.S. states, behind only Nevada and Michigan, according to Labor Department figures. The national rate rose to 9.6 percent in August from 9.5 percent in July, hovering near a 26-year high of 10.1 percent in October.

U.S. Consumer Sentiment Index Declines Unexpectedly

Posted By on September 17, 2010

Maybe the government isn’t reading the room, how can anyone say the consumer sentiment drop was unexpected!

Confidence among U.S. consumers unexpectedly dropped to a one-year low in September, indicating the biggest part of the economy is being held back by a struggling labor market.

The Thomson Reuters/University of Michigan preliminary index of consumer sentiment fell to 66.6 from 68.9 in August, the group said today. This month’s reading was less than the most pessimistic forecast in a Bloomberg News survey.

Household Net Worth Statistics

Posted By on September 17, 2010

Key words here: Households managed to pare down their debts for the ninth-straight quarter, largely by defaulting on mortgages and credit-card debts.

The Federal Reserve reported Friday that household net worth—stocks, bonds, homes and other assets, minus mortgages and other debts—fell 2.8% to $53.5 trillion in the second quarter, driven by a sharp decline in the value of stock investments.

Households managed to pare down their debts for the ninth-straight quarter, largely by defaulting on mortgages and credit-card debts. Total household debt outstanding fell $77 billion to $13.5 trillion in the second quarter. That’s just barely more than the value of mortgage and credit-card debt that banks and other investors wrote off after borrowers defaulted. Commercial-bank records suggest such write-offs amounted to more than $70 billion.

Income Distribution…..50% Of Our Population Lives On $46,326 Or Less

Posted By on September 16, 2010

The median household income in the United States is $46,326.  That means 50 percent of our population lives on $46,326 or less a year. 

Dual earner households have a higher median income at $67,348.

To highlight this discrepancy, here is a chart showing how the household income is distributed:

U.S. Income Distribution

More at: http://www.mybudget360.com/how-much-does-the-average-american-make-breaking-down-the-us-household-income-numbers/

Baseline Blue Emissions Chart

Posted By on September 16, 2010

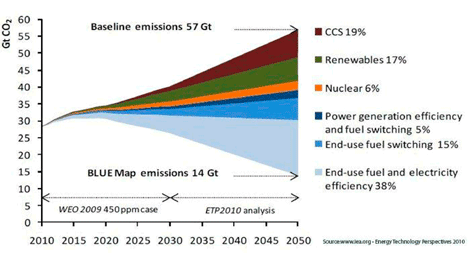
While the world is expected to reduce emissions to 50% by 2050 in the BLUE scenario, it is the OECD that will bear the real burden. Non- OECD countries can get away with just a 50% reduction; OECD countries are looking at cutting 70-80% of their 2007 emissions. This would mean that the electricity sector for these 32 countries would have be “almost completely decarbonized” by 2050.

BLUE Map Emissions

Poverty Rate Increases To 43.6 Million Americans Or 14.3% Up From 13.2% In 2008

Posted By on September 16, 2010

Incomes for the average U.S. household fell slightly last year after  substantial government aid and actions of families doubling up and young adults moving in with their parents muted the impact of the worst recession since the 1930s, the Census Bureau said Thursday.

The bureau’s annual snapshot of American living standards also found that the fraction of Americans living in poverty rose sharply to 14.3% from 13.2% in 2008, its highest level since 1994. A record 43.6 million Americans were living in poverty last year, the Census Bureau said.

The new data underscore the extent to which U.S. households relied on government benefits—and each other—to weather the recession. The numbers also show just how much living standards of the middle of the middle class have stalled.

President Barack Obama said Thursday that economic-stimulus spending had kept millions more Americans out of poverty. “Even before the recession hit, middle-class incomes had been stagnant and the number of people living in poverty in America was unacceptably high, and today’s numbers make it clear that our work is just beginning,” he said in a statement.

[uspovertyrate10] 

The median household income, the pretax income of households smack in the middle of the middle incomers, fell 0.7% to $49,777 in 2009. It is down 4.2% from the prerecession year of 2007.

“It’s going to be a long, hard slog back to what most Americans think of as normalcy or prosperous times,” said Nicholas Eberstadt, a political economist at the right-leaning American Enterprise Institute.

Economists have been concerned about the persistently high unemployment rate, which rose 3.5 percentage points to 9.3% in 2009 from 5.8% in 2008, the largest increase since the Labor Department started keeping comparable average annual data in 1947.

“The deterioration in the labor market from 2008 to 2009 was the worst we’ve ever seen,” said Heidi Shierholz, a labor economist with the Economic Policy Institute, a Washington think tank. “When you see a big deterioration in the labor market, poverty rises. The vast majority of people in this country depend on the labor market for their income.”

Bank Home Repossessions Jump 25% From One Year Earlier, Setting New Record

Posted By on September 16, 2010

U.S. home seizures reached a record for the third time in five months in August as lenders completed the foreclosure process for thousands of delinquent owners, according to RealtyTrac Inc.

Bank repossessions climbed 25 percent from a year earlier to 95,364, the most since the Irvine, California-based data provider began keeping records.

“We’re on track for a record year for homes in foreclosure and repossessions,” Rick Sharga, RealtyTrac’s senior vice president, said in a telephone interview. “There is no improvement in the underlying economic conditions.”

Foreclosures are contributing to a growing housing supply that may add as many as 12 million homes to the U.S. market. Demand is crumbling amid high unemployment and following the expiration of a federal homebuyer tax credit in April. Sales of new and existing homes fell in July to the lowest level on record. Home prices have fallen 28 percent since 2006, according to the S&P/Case-Shiller index of values in 20 U.S. cities.

U.S. Home Prices May Face 3 More Years Of Decline As Inventory Surges

Posted By on September 15, 2010

Bloomberg    

 09-15-2010

The slide in U.S. home prices may have another three years to go as sellers add as many as 12 million more properties to the market.

Shadow inventory — the supply of homes in default or foreclosure that may be offered for sale — is preventing prices from bottoming after a 28 percent plunge from 2006, according to analysts from Moody’s Analytics Inc., Fannie Mae, Morgan Stanley and Barclays Plc. Those properties are in addition to houses that are vacant or that may soon be put on the market by owners.

“Whether it’s the sidelined, shadow or current inventory, the issue is there’s more supply than demand,” said Oliver Chang, a U.S. housing strategist with Morgan Stanley in San Francisco. “Once you reach a bottom, it will take three or four years for prices to begin to rise 1 or 2 percent a year.”

Rising supply threatens to undermine government efforts to boost the housing market as homebuyers wait for better deals. Further price declines are necessary for a sustainable rebound as a stimulus-driven recovery falters, said Joshua Shapiro, chief U.S. economist of Maria Fiorini Ramirez Inc., a New York economic forecasting firm.

Sales of new and existing homes fell to the lowest levels on record in July as a federal tax credit for buyers expired and U.S. unemployment remained near a 26-year high. The median price of a previously owned home in the month was $182,600, about the level it was in 2003, the National Association of Realtors said.

Fannie Mae Forecast

Fannie Mae, the largest U.S. mortgage finance company, today lowered its forecast for home sales this year, projecting a 7 percent decline from 2009. A drop in demand after the April 30 tax credit expiration “suggests weakening home prices” in the third quarter, according to the report.

There were 4 million homes listed with brokers for sale as of July. It would take a record 12.5 months for those properties to be sold at that month’s sales pace, according to the Chicago- based Realtors group.

“The best thing that could happen is for prices to get to a level that clears the market,” said Shapiro, who predicts prices may fall another 10 percent to 15 percent. “Right now, buyers know it hasn’t hit bottom, so they’re sitting on the sidelines.”

More at: http://www.bloomberg.com/news/2010-09-15/u-s-home-prices-face-three-year-drop-as-inventory-surge-looms.html

Unprecedented 19th Sequential Equity Outflow, $10 Billion In September Redemptions

Posted By on September 15, 2010

ICI’s latest data discloses that in the week ended September 8, domestic funds saw outflows of $2.2 billion, following last week’s massive $7.7 billion. And  ETFs experienced outflows as well. So far September has experienced nearly $10 billion in outflows, even as the market has ramped by over 6%.  This is the 19th sequential outflow from US stocks, and amounts to $65 billion in redemptions for the year. With the market pretty much unchanged YTD, it means that mutual funds can not resort to capital appreciation as a substitute to outflows. Interesting fact: the S&P is at the level it was when the outflows began back during the flash crash.

Weekly YTD Outflows:

Cumulative YTD Outflows:

Pension Deficit Disorder

Posted By on September 15, 2010

The funded status of the 100 largest corporate defined benefit pension plans dropped by $108 billion during August 2010 as measured by the Milliman 100 Pension Funding Index (PFI). The funded status decrease was primarily due to a significant decrease in corporate bond interest rates that are the benchmarks used to value pension liabilities. Though not as significant, the financial markets performed poorly in August 2010 as well. As of August 31, 2010, the funded ratio plummeted to 70.1%, down from 75.6% at the end of July 2010. This marks the lowest funded ratio recorded within the last 10 years for the Milliman 100 PFI. The last time the funded ratio was nearly this low was on May 31, 2003, when it was 70.5%.

U.S. Retail Sales Numbers From Census Report

Posted By on September 14, 2010

U.S. Retail Sales came essentially in line with consensus at 0.4% versus expectations of 0.3%. The previous number was revised from 0.4% to 0.3%.   Auto sales dropped both M/M and Y/Y.

From the Census Report:

The U.S. Census Bureau announced today that advance estimates of U.S. retail and food services sales for August, adjusted for seasonal variation and holiday and trading-day differences, but not for price changes, were $363.7 billion, an increase of 0.4 percent (±0.5%)* from the previous month, and 3.6 percent (±0.5%) above August 2009. Total sales for the June through August 2010 period were up 4.7 percent (±0.3%) from the same period a year ago. The June to July 2010 percent change was revised from +0.4 percent (±0.5%)* to +0.3 percent (±0.2%).

Retail trade sales were up 0.5 percent (±0.5%)* from July 2010, and 3.7 percent (±0.7%) above last year. Non store (internet) retailers sales were up 10.5 percent (±2.8%) from August 2009 and gasoline stations sales were up 9.6 percent (±1.8%) from last year. 

According to Gallup, consumer spending declined 5.9% on the 14 Day Rolling Average in August from July, and 7.2% on the 3 DRA.

Corporate Pension Underfunding Hits Record $460 Billion Deficit

Posted By on September 14, 2010

A $108 Billion Deterioration In ONE MONTH

www.zerohedge.com      09-14-2010

According to actuarial and consulting firm Miliman, in August 2010, the funded status of the 100 largest defined benefit pension plans sponsored by U.S. companies dropped by $108 billion to a 10-year low of 70.1%. Yes, that’s a $100 billion + deterioration in one month!  The main reason for the decline in funded status was due to a large decrease in corporate bond interest rates.  It’s the unintended consequences of pushing all markets so far from equilibrium.  We now see the adverse side effects. Soon pension funds like the Illinois TRS and others will compound their mistakes and tens of millions of people who have diligently saved all their lives only to wake up one day and find they have little money left at all.  Expect to hear much more about this side effect of the Fed’s  Keynesian solution as we go forward.

More Entitlements Then Ever….The Free Lunch

Posted By on September 14, 2010

Nearly half of all Americans live in a household in which someone receives government benefits.  This is more than at any time in history.

Making matters even worse, the number of American households not paying federal income taxes has also grown—to an estimated 45% in 2010, from 39% five years ago, this according to the Tax Policy Center.   A little more than half don’t earn enough to be taxed; the rest take so many credits and deductions they don’t owe anything.

“We have a very large share of the American population that is getting checks from the government,” says Keith Hennessey, an economic adviser to President George W. Bush and now a fellow at the conservative Hoover Institution, “and an increasingly smaller portion of the population that’s paying for it.”

Stratfor….Elections And Obama’s Foreign Policy Choices

Posted By on September 14, 2010

September 14, 2010 | 0856 GMT
 
Geopolitical Weekly

We are now nine weeks away from the midterm elections in the United States. Much can happen in nine weeks, but if the current polls are to be believed, U.S. President Barack Obama is about to suffer a substantial political reversal. While we normally do not concern ourselves with domestic political affairs in the United States, when the only global power is undergoing substantial political uncertainty, that inevitably affects its behavior and therefore the dynamics of the international system. Thus, we have to address it, at least from the standpoint of U.S. foreign policy. While these things may not matter much in the long run, they certainly are significant in the short run.

To begin thinking about this, we must bear three things in mind. First, while Obama won a major victory in the Electoral College, he did not come anywhere near a landslide in the popular vote. About 48 percent of the voters selected someone else. In spite of the Democrats’ strength in Congress and the inevitable bump in popularity Obama received after he was elected, his personal political strength was not overwhelming. Over the past year, poll numbers indicating support for his presidency have deteriorated to the low 40 percent range, numbers from which it is difficult, but not impossible, to govern.

Second, he entered the presidency off balance. His early focus in the campaign was to argue that the war in Iraq was the wrong war to fight but that the war in Afghanistan was the right one. This positioned him as a powerful critic of George W. Bush without positioning him as an anti-war candidate. Politically shrewd, he came into office with an improving Iraq situation, a deteriorating Afghanistan situation and a commitment to fighting the latter war. But Obama did not expect the global financial crisis. When it hit full blast in September 2008, he had no campaign strategy to deal with it and was saved by the fact that John McCain was as much at a loss as he was. The Obama presidency has therefore been that of a moderately popular president struggling between campaign promises and strategic realities as well as a massive economic crisis to which he crafted solutions that were a mixture of the New Deal and what the Bush administration had already done. It was a tough time to be president.

Third, while in office, Obama tilted his focus away from the foreign affairs plank he ran on to one of domestic politics. In doing so, he shifted from the area where the president is institutionally strong to the place where the president is institutionally weak. The Constitution and American tradition give the president tremendous power in foreign policy, generally untrammeled by other institutions. Domestic politics do not provide such leeway. A Congress divided into two houses, a Supreme Court and the states limit the president dramatically. The founders did not want it to be easy to pass domestic legislation, and tradition hasn’t changed that. Obama can propose, but he cannot impose.

Therefore, the United States has a president who won a modest victory in the popular vote but whose campaign posture and the reality under which he took office have diverged substantially. He has been drawn, whether by inclination or necessity, to the portion of his presidency where he is weakest and most likely to face resistance and defeat. And the weaker he gets politically the less likely he is to get domestic legislation passed, and the defeats will increase his weakness.

He does not, at the moment, have a great deal of public support to draw on, and the level of vituperation from the extremes has reached the level it was with George W. Bush. Where Bush was accused by the extreme left of going into Iraq to increase profits for Halliburton and the oil companies, Obama is being accused by the extreme right of trying to create a socialist state. Add to this other assorted nonsense, such as the notion that Bush engineered 9/11 or that Obama is a secret Muslim, and you get the first whiff of a failed presidency. This is not because of the prospect of midterm reversals — that has happened any number of times. It is because Obama, like Bush, was off balance from the beginning.

If Obama suffers a significant defeat in Congress in the November elections, he will not be able to move his domestic agenda. Indeed, Obama doesn’t have to lose either house to be rendered weak. The structure of Congress is such that powerful majorities are needed to get anything done. Even small majorities can paralyze a presidency.

Under these circumstances, he would have two choices. The first is to go into opposition. Presidents go into opposition when they lose support in Congress. They run campaigns against Congress for blocking their agenda and blame Congress for any failures. Essentially, this was Bill Clinton’s strategy after his reversals in 1994, and it worked in 1996. It is a risky strategy, obviously. The other option is to shift from the weak part of the presidency to the strong part, foreign policy, where a president can generally act decisively without congressional backing. If Congress does resist, it can be painted as playing politics with national security. Since Vietnam, this has been a strategy Republican presidents have used, painting Democratic Congresses as weak on national security.

There is a problem in Obama choosing the second strategy. For Republicans, this strategy plays to their core constituency, for whom national security is a significant issue. It also is an effective tool to reach into the center. The same isn’t true for the Democrats. Obama’s Afghanistan policy has already alienated the Democratic left wing, and the core of the Democratic Party is primarily interested in economic and social issues. The problem for Obama is that focusing on foreign policy at the expense of economic and social issues might gain him some strength in the center, but probably wouldn’t pick him up many Republican votes and would alienate his core constituency.

This would indicate that Obama’s best strategy is to go into opposition, government against Congress. But there are two problems with this. One of the underlying themes of the Obama presidency is that he is ineffective in getting his economic agenda implemented. That’s not really true, given the successes he has had with health-care reform and banking regulation, but it is still a theme. The other problem he has is the sense that he has surged in Afghanistan while setting a deadline for withdrawal and that his Afghan policy is merely a political gesture.

Obama can’t escape national security issues. Clinton could. In 1996, there were no burning issues in foreign policy. There are now two wars under way. Obama can’t ignore them even if his core constituency has a different agenda. Going into opposition against Congress could energize his base, but that base is in the low 40s. He needs to get others on board. He could do that if he could pass legislation he wanted, but the scenario we are looking at will leave him empty-handed when it comes time for re-election. His strongest supporters will see him as the victim, but a victimized president will have trouble putting together a winning coalition in 2012. He can play the card, but there has to be more.

We come back to foreign policy as a place where Obama will have to focus whether he likes it or not. He takes his bearings from Franklin Roosevelt, and the fact is that Roosevelt had two presidencies. One was entirely about domestic politics and the other about foreign policy, or the Depression and then World War II. This was not a political choice for Roosevelt, but it was how his presidency worked out. For very different reasons, Obama is likely to have his presidency bifurcated. With his domestic initiatives blocked, he must turn to foreign policy.

Here, too, Obama has a problem. He ran his campaign, in the Democratic tradition, with a vague anti-war theme and a heavy commitment to the American-alliance structure. He was also a strong believer in what has been called soft power, the power of image as opposed to that of direct force. This has not been particularly successful. The atmospherics of the alliance may be somewhat better under Obama than Bush, but the Europeans remain as fragmented and as suspicious of American requests under Obama as they were under Bush. Obama got the Nobel Prize but precious little else from the Europeans. His public diplomacy initiative to the Islamic world also did not significantly redefine the game. Relations with China have improved but primarily because the United States has given up on revaluation of the yuan. It cannot be argued that Obama’s strategy outside the Islamic world has achieved much. It could be claimed that any such strategy takes time, Obama’s problem is that he is running out of political maneuvering room.

That leaves the wars that are continuing, Iraq and Afghanistan. We have argued that Afghanistan is the wrong war in the wrong place. It is difficult to know how Obama views it, given his contradictory signals of increasing the number of troops but setting a deadline for beginning their withdrawal. We have argued that a complete withdrawal from Iraq without a settlement with Iran or the decimation of Iran’s conventional forces would be a mistake, but we don’t know, obviously, what Obama’s view on this is. We do not know his view of the effect of the Afghan war on U.S. strategic posture or on Pakistan, and we do not know his view of the impact of U.S. withdrawal from Iraq on Iranian influence in the Persian Gulf.

Let’s assume that he has clear views, which is likely for a president, and he is playing a long and quiet game. This would not be a bad strategy if he were stronger and had more time. But if the polls hold he will be weaker and running out of time. It would therefore follow that Obama will come out of the November election having to turn over his cards on the only area where he can have traction — Iraq, Iran and Afghanistan. The question is what he might do.

One option is to solve the Iraq problem by attacking Iran’s nuclear facilities. This carries the risk, as I have said many times, of Iranian retaliation in the Strait of Hormuz and a massive hit on the Western economic revival. In that sense, a strike against Iranian nuclear targets alone would be the riskiest. Far safer is a generalized air campaign against both Iran’s nuclear and conventional capability.

But launching a new war, while two others go on, is strategically risky. From a political point of view, it would alienate Obama’s political base, many of whom supported him because he would not undertake unilateral military moves. The Republicans would be most inclined to support him, but most would not vote for him under any circumstances. Plus, brilliant military strokes have the nasty habit of bogging down just as mediocre ideas do. That would end the Obama presidency. Clinton’s war in Kosovo was not an easy option for him strategically or politically.

That leaves another option that we have suggested before, one that would appeal both to Obama’s sensibility and to his political situation: pulling a Nixon. In 1971, Richard Nixon reached out to China while Chinese weapons were being used to kill American soldiers in Vietnam. Roosevelt did the same with the Soviets in 1941. There is a tradition in the United States of a diplomatic stroke with ideological enemies to achieve strategic ends.

Diplomatic strokes appeal to Obama. They also would appeal to his political base, while any agreement with Iran that would contribute to an American withdrawal from Iraq and perhaps from Afghanistan would appeal to the center. The Republicans would be appalled, but Obama can’t win them over anyway so it doesn’t matter. Indeed, he can use their hostility to strengthen his own base.

What the settlement with Iran might look like is murky at best. Whether Iran has any interest in such a settlement is murkier still. But if Obama gets hammered in the midterms, his domestic agenda will be frozen. He doesn’t have the personal strength and credibility to run against Congress for two years and then get re-elected. He retains his power in foreign affairs but he has not gotten traction on a multilateral reconstruction of America’s global popularity. He has two wars ongoing, plus a major challenge from Iran. Attacking Iran from the air might or might not work, and it could weaken him politically. That leaves him with running against Congress or addressing the Middle East with a diplomatic masterstroke.

It is difficult to know the ways of presidents, particularly one who has tried hard to be personally enigmatic. But it is easier to measure the political pressures that are confronting him and shaping his decisions. I wouldn’t be so bold as to predict his actions, but I would argue that he faces some unappetizing choices that he could solve with a very bold move in foreign policy. His options on the domestic side will disappear if the polls are right.

Reprinting or republication of this report on websites is authorized by prominently displaying the following sentence, including the hyperlink to STRATFOR, at the beginning or end of the report.

Elections and Obama’s Foreign Policy Choices is republished with permission of STRATFOR.”

More at:  www.strafor.com
 

Mutual Fund Cash At All Time Record Low Of 3.4% Of Assets In Most Recent Reporting Period…..This Is Long Term Negative For Equity Markets

Posted By on September 13, 2010

Igor A Category 5 Hurricane Is On Its Way….Bermuda and Newfoundland, Canada At Highest Risk

Posted By on September 13, 2010

Additionally there are also other systems of concern in the basin, such as Julia farther east and the possibility of Karl forming in the disturbed weather currently in the Caribbean.

Igor continued on a strengthening phase into Monday.

The last Category 5 hurricane in the Atlantic was Felix in 2007. That season yielded two Category 5 storms. The other Category 5 system that year was Dean. Both systems held that level for a 24-hour period.

Igor is forecast by the AccuWeather.com Hurricane Center to begin a curve to the northwest over the next 24 to 48 hours, steering the system to the northeast of the Antilles.

However, building surf will affect the water around the Leeward Islands over the next several days.

Of great concern is how close the system will track to Bermuda over the weekend. The large size of the storm could cause considerable problems for the islands, even if a direct hit does not occur.

However, there is still a chance Igor could slide more westward, missing one or more northward turn-offs, possibly bringing it too close to the Atlantic Seaboard of the U.S. for comfort and more serious problems.

For now, people in Bermuda and Newfoundland, Canada, area highest on the risk for direct impact from Hurricane Igor.

All interests along the Atlantic Seaboard should keep an eye on Igor.

New York Fed To Buy $27 Billion In Treasurys……

Posted By on September 13, 2010

So what will bolt from the gate fastest Stocks, Bonds or could Gold and Silver lead the way? 

The New York Fed has just disclosed it will buy $27 billion in Treasurys between mid-Sept and mid-October. Using the Basel III blessed 30x leverage, this money, once it makes its way to the Primary Dealers, should be sufficient for a $750 billion leveraged push higher in risk assets. 

www.zerohedge.com

John Williams Of Shadow Stats Says Economic Downturn Re-Intensifies!

Posted By on September 13, 2010

From John Williams of shadowstats.com………

– Protracted Economic Downturn Re-Intensifies 
– Systemic Stability: “Tap-Dancing on a Land Mine” 
– Risks of U.S. Dollar Instability and Systemic-Salvation Efforts Pose     
     Severe Inflation Threat

www.shadowstats.com

Market Liquidity Update: 112 Stocks Now Account For Half The Day’s Trading Volume

Posted By on September 13, 2010

Hmm, this is a rather stunning study to say the least.  And people wonder why there is a flight from equities into bonds.

09-13-2010

The latest Abel/Noser analysis has been released and according to the data analytics firm just 112 stocks now account for half of the day’s volume, the top 20 stocks account for 26% of all domestic volumes, and the first 1,029 stocks are responsible for 90% of all volume, meaning the remaining 17,349 account for just 10% of all dollar traded. These are also the stocks where HFT will never tread, so if anyone wishes to avoid the HFT marauders, just stay away from the top names. And since the last time we did an update, there have been some notable changes in the top 10 most traded names: in June, courtesy of the GOM catastrophe, BP and Exxon were solidly in the most traded stocks. Since then they have fallen way down in the listing, having been replaced with two other M&A candidates, HP and Potash, in 7th and 10th place, respectively. Intel has also done a great job of getting raped daily by HFTs, moving up from 19th place, to 8th. Yet not surprisingly, as the total volume of shares has fallen off a cliff since June, the 16th most active stock, Google, just barely makes the $1 billion in principal traded day cutoff at 16th place, while in June, all of the top 20 names were trading above $1.2 billion notional daily. And once again, just like every other month, the most actively traded security continues to be the SPY. As ever more of the volume is concentrated in fewer and fewer stocks, it is certain that one day, when a top 10 name crashes, it will take the the entire market with it.  Add to that…..markets continue to trade near record-high implied correlations.

Here are the specific findings from August data:

  • SPY (SPDR Trust Series 1) accounted for over 10% of the total domestic principal traded.
  • The cumulative volume of the top twenty equities, sorted by average daily principal traded, represent over 26% of domestic principal traded.
  • Once you reach just the 112th  ranked symbol, you have accounted for over half of a day’s volume.
  • The first 1,029 names account for a full 90% of all volume.
  • The remaining 17,349 equities* account for the remaining 10% of all dollars traded.

www.zerohedge.com

World Commodities…..An Interactive Look At What’s Left

Posted By on September 12, 2010

09/12/2010

Scientific American has done a summary of peak commodity levels as well as depletion projections for some of the most critical resources in the world including oil, gold, silver copper, not to mention renewable water, as well as estimating general food prices over the next half century. Generally speaking, regardless of whether one believes in peak oil or not, the facts are that stores of natural resources are disappearing at an increasingly alarming pace. Some key highlights from Scientific American, as well as the year in which a given resource either peaks or runs out:

Oil – 2014 Peak

The most common answer to “how much oil is left” is “depends on how hard you want to look.” As easy-to-reach fields run dry, new technologies allow oil companies to tap harder-to-reach places (such as 5,500 meters under the Gulf of Mexico). Traditional statistical models of oil supply do not account for these advances, but a new approach to production forecasting explicitly incorporates multiple waves of technological improvement. Though still controversial, this multi-cyclic approach predicts that global oil production is set to peak in four years and that by the 2050s we will have pulled all but 10% of the world’s oil from the ground.

In many parts of the world, one major river supplies water to multiple countries. Climate change, pollution and population growth are putting a significant strain on supplies. In some areas renewable water reserves are in danger of dropping below the 500 cubic meters per person per year considered a minimum for a functioning society.

Renewable Water

Indium – 2028

Silver – 2029

Gold – 2030

Copper – 2044

Coal – 2072

Food Prices over next 40 years

Researchers have recently started to untangle the complex ways rising temperatures will affect global agriculture. The expect climate change to lead to longer growing seasons in some countries; in others the heat will increase the frequency of extreme weather events or the prevalence of pests. In the US, productivity is expected to rise in Plains states, but fall further in the already struggling Southwest. Russia and China will gain, India and Mexico will lose. In general, developing nations will take the biggest hits. By 2050 counteracting the ill effects of climate change on nutrition will cost more than $7 billion a year. 

More at: http://www.zerohedge.com/article/peak-everything-interactive-look-how-much-everything-left

Geithner Says Action On Economy Important Now!

Posted By on September 12, 2010

Nice to know that someone is on the job!

WASHINGTON    Treasury Secretary Timothy Geithner said Washington can under cut an already slow economic recovery if it fails to provide quick  support to business and individuals.

“If the government does nothing going forward, then the impact of policy in Washington will shift from supporting economic growth to hurting economic growth,” Mr. Geithner said during an interview with The Wall Street Journal in his U.S. Treasury office.

The Consumer And Debt

Posted By on September 11, 2010

If not for record low interest rates, the Debt Service Ratio chart below would look a lot different!

The consumer, and why the expectation (and reality) of deflation will keep U.S. buyers subdued, and continue to make the US economy ever more reliant on the government’s transfer payment, aka welfare, program.

A very simple illustration of the challenge is provided in Exhibit 1, which shows that the ratio of household debt to disposable income remains far above levels prevailing prior to the asset price and credit boom that started in the late 1990s. This suggests that the deleveraging of household balance sheets still has much further to go.

But while the ratio of household debt remains exceptionally high, the ratio of household debt service interest and scheduled principal repayments to disposable income looks less out of line with longer-term norms. This is shown in Exhibit 2, which plots the household debt service ratio as calculated by the Federal Reserve Board.1 Although it is still above its long-term average, the gap was never as big as in the case of the debt ratio and has declined substantially since 2007. What should we make of this?

And here is the kicker, explaining why once again the Fed has misunderestimated American consumers:

While the debt/income ratio shown in Exhibit 1 is hardly the end of the story, we believe that Exhibit 2 leaves out an important factor, namely that debt service is defined in nominal rather than real terms. The calculation does not take into account the rate at which inflation erodes the real value of household debt over time. This erosion will confer a bigger benefit on indebted households in a high-inflation environment such as the early 1980s than in a low inflation environment such as now.

More at: http://www.zerohedge.com/article/why-real-not-nominal-consumer-debt-burden-will-push-us-economy-lower-and-force-fed-accelerat

More Stringent Mortgage Underwriting Standards Sought By The FDIC

Posted By on September 11, 2010

FDIC’s Bair Warns of Government “Exposure” in Mortgages

WASHINGTON (Reuters) – A key U.S. banking regulator raised concern on Wednesday about the risk of “exposure” the government is taking on in the mortgage market and urged more stringent standards for underwriting mortgages.

“We should all be concerned about the type of exposure that the government is taking on through guaranteeing so many mortgages right now and make sure that we do have some prudent underwriting standards,” Federal Deposit Insurance Corp Chairman Sheila Bair suggested in an interview on CNBC.

“The government is taking on a lot of exposure and guaranteeing most mortgages that are being originated these days,” she said. “And I think the policymakers here are trying to balance the need for prudent underwriting with a need to support… what is still a very distressed housing market.”

Mortgage finance giants Fannie Mae and Freddie Mac, under government control since September 2008, and the Federal Housing Administration, currently back some 90 percent of new U.S. mortgages.

Treasury Secretary Timothy Geithner said last month the U.S. government’s role in housing finance should undergo “fundamental change,” but that it should still provide some guarantees in the $10.7 trillion mortgage market.

More…

McDonald’s New Obama Value Menu

Posted By on September 10, 2010

Q: Have you heard about McDonald’s’ new Obama Value Meal?

 
A: Order anything you like and the guy behind you has to pay for it.

         —Conan O’Brien


This Looks Like A Reasonable Real Estate Assumption Based On Our Current Economic Situation

Posted By on September 10, 2010


More: http://www.moneytalks.net/images/stories/August_26/Psychological-Stages-of-a-RE-Bubble-Market1.png

Tropical Storm Igor Weakens

Posted By on September 10, 2010

www.ingerlette.com

Commercial Backed Loans In Delinquency Are $3.1 Billion In August

Posted By on September 10, 2010

Interesting fact…..stock market REIT ‘s (Real Estate Investment Trusts) are trading at near record highs.

Of the $3.1 billion new delinquencies in August, $1.1 billion (36%) corresponded to hotel-backed loans, pushing the hotel-specific delinquency rate past 20%. Current delinquency rates by property type are as follows:

–Hotel: 20.80% (from 18.64%)
–Multifamily: 14.18% (from 13.87%)
–Retail: 6.11% (from 6.35%)
–Industrial: 5.55% (from 5.20%)
–Office: 5.06% (from 5.08%)

Shifting Demographics And The New Normal

Posted By on September 9, 2010

Shifting Demographics 

A factor affecting demand is shifting demographics. The Baby Boomer generation is no longer the consumption engine it has been to the US economy.


We have a generation that, as has been predicted for some time, is reducing its expenses but it may be even more dramatic than forecasted. With home housing prices no longer being the wealth generation vehicle they had expected it to be, stocks not delivering the returns they had been told to expect for the ‘long term’ investor and medical expenses climbing above their worst budgeted targets, the baby boomers are being forced to cut back even further than the expected demographics were warning about.

The demand for credit to finance new acquisitions is not the same priority it was only a few years ago. Harry Dent’s extensive demographic research lays this out in indisputable detail.

All Federal Reserve and Government actions are about increasing credit supply.  None effectively address demand.  

THE RESULT

Expect it to get worse until the administration finally realizes that we have both a structural and demand problem facing America, not a cyclical business cycle and credit availability problem. I personally don’t believe for a minute that the Obama Administration haven’t come to realize something is wrong. The White House simply doesn’t know what to do about it. They are doing the only thing our Washington political machine knows what to do – throw money and credit at the problem, which is precisely what got us into this problem in the first place.

 Gordon T Long    

Gauging The Threat Of An Electromagnetic Pulse (EMP) Attack

Posted By on September 9, 2010

September 9, 2010
Militancy and the U.S. Drawdown in Afghanistan
By Scott Stewart and Nate Hughes
 
Over the past decade there has been an ongoing debate over the threat posed by electromagnetic pulse (EMP) to modern civilization. This debate has been the most heated perhaps in the United States, where the commission appointed by Congress to assess the threat to the United States warned of the dangers posed by EMP in reports released in 2004 and 2008. The commission also called for a national commitment to address the EMP threat by hardening the national infrastructure.
There is little doubt that efforts by the United States to harden infrastructure against EMP — and its ability to manage critical infrastructure manually in the event of an EMP attack — have been eroded in recent decades as the Cold War ended and the threat of nuclear conflict with Russia lessened. This is also true of the U.S. military, which has spent little time contemplating such scenarios in the years since the fall of the Soviet Union. The cost of remedying the situation, especially retrofitting older systems rather than simply regulating that new systems be better hardened, is immense. And as with any issue involving massive amounts of money, the debate over guarding against EMP has become quite politicized in recent years.

We have long avoided writing on this topic for precisely that reason. However, as the debate over the EMP threat has continued, a great deal of discussion about the threat has appeared in the media. Many STRATFOR readers have asked for our take on the threat, and we thought it might be helpful to dispassionately discuss the tactical elements involved in such an attack and the various actors that could conduct one. The following is our assessment of the likelihood of an EMP attack against the United States.

Defining Electromagnetic Pulse

EMP can be generated from natural sources such as lightning or solar storms interacting with the earth’s atmosphere, ionosphere and magnetic field. It can also be artificially created using a nuclear weapon or a variety of non-nuclear devices. It has long been proven that EMP can disable electronics. Its ability to do so has been demonstrated by solar storms, lightning strikes and atmospheric nuclear explosions before the ban on such tests. The effect has also been recreated by EMP simulators designed to reproduce the electromagnetic pulse of a nuclear device and study how the phenomenon impacts various kinds of electrical and electronic devices such as power grids, telecommunications and computer systems, both civilian and military.

The effects of an EMP — both tactical and strategic — have the potential to be quite significant, but they are also quite uncertain. Such widespread effects can be created during a high-altitude nuclear detonation (generally above 30 kilometers, or about 18 miles). This widespread EMP effect is referred to as high-altitude EMP or HEMP. Test data from actual high-altitude nuclear explosions is extremely limited. Only the United States and the Soviet Union conducted atmospheric nuclear tests above 20 kilometers and, combined, they carried out fewer than 20 actual tests.

As late as 1962 — a year before the Partial Test Ban Treaty went into effect, prohibiting its signatories from conducting aboveground test detonations and ending atmospheric tests — scientists were surprised by the HEMP effect. During a July 1962 atmospheric nuclear test called “Starfish Prime,” which took place 400 kilometers above Johnston Island in the Pacific, electrical and electronic systems were damaged in Hawaii, some 1,400 kilometers away. The Starfish Prime test was not designed to study HEMP, and the effect on Hawaii, which was so far from ground zero, startled U.S. scientists.

High-altitude nuclear testing effectively ended before the parameters and effects of HEMP were well understood. The limited body of knowledge that was gained from these tests remains a highly classified matter in both the United States and Russia. Consequently, it is difficult to speak intelligently about EMP or publicly debate the precise nature of its effects in the open-source arena.

The importance of the EMP threat should not be understated. There is no doubt that the impact of a HEMP attack would be significant. But any actor plotting such an attack would be dealing with immense uncertainties — not only about the ideal altitude at which to detonate the device based on its design and yield in order to maximize its effect but also about the nature of those effects and just how devastating they could be.

Non-nuclear devices that create an EMP-like effect, such as high-power microwave (HPM) devices, have been developed by several countries, including the United States. The most capable of these devices are thought to have significant tactical utility and more powerful variants may be able to achieve effects more than a kilometer away. But at the present time, such weapons do not appear to be able to create an EMP effect large enough to affect a city, much less an entire country. Because of this, we will confine our discussion of the EMP threat to HEMP caused by a nuclear detonation, which also happens to be the most prevalent scenario appearing in the media.

Attack Scenarios

In order to have the best chance of causing the type of immediate and certain EMP damage to the United States on a continent-wide scale, as discussed in many media reports, a nuclear weapon (probably in the megaton range) would need to be detonated well above 30 kilometers somewhere over the American Midwest. Modern commercial aircraft cruise at a third of this altitude. Only the United States, United Kingdom, France, Russia and China possess both the mature warhead design and intercontinental ballistic missile (ICBM) capability to conduct such an attack from their own territory, and these same countries have possessed that capability for decades. (Shorter range missiles can achieve this altitude, but the center of the United States is still 1,000 kilometers from the Eastern Seaboard and more than 3,000 kilometers from the Western Seaboard — so just any old Scud missile won’t do.)

The HEMP threat is nothing new. It has existed since the early 1960s, when nuclear weapons were first mated with ballistic missiles, and grew to be an important component of nuclear strategy. Despite the necessarily limited understanding of its effects, both the United States and Soviet Union almost certainly included the use of weapons to create HEMPs in both defensive and especially offensive scenarios, and both post-Soviet Russia and China are still thought to include HEMP in some attack scenarios against the United States.

However, there are significant deterrents to the use of nuclear weapons in a HEMP attack against the United States, and nuclear weapons have not been used in an attack anywhere since 1945. Despite some theorizing that a HEMP attack might be somehow less destructive and therefore less likely to provoke a devastating retaliatory response, such an attack against the United States would inherently and necessarily represent a nuclear attack on the U.S. homeland and the idea that the United States would not respond in kind is absurd. The United States continues to maintain the most credible and survivable nuclear deterrent in the world, and any actor contemplating a HEMP attack would have to assume not that they might experience some limited reprisal but that the U.S. reprisal would be full, swift and devastating.

Countries that build nuclear weapons do so at great expense. This is not a minor point. Even today, a successful nuclear weapons program is the product of years — if not a decade or more — and the focused investment of a broad spectrum of national resources. Nuclear weapons also are developed as a deterrent to attack, not with the intention of immediately using them offensively. Once a design has achieved an initial capability, the focus shifts to establishing a survivable deterrent that can withstand first a conventional and then a nuclear first strike so that the nuclear arsenal can serve its primary purpose as a deterrent to attack. The coherency, skill and focus this requires are difficult to overstate and come at immense cost — including opportunity cost — to the developing country. The idea that Washington will interpret the use of a nuclear weapon to create a HEMP as somehow less hostile than the use of a nuclear weapon to physically destroy an American city is not something a country is likely to gamble on.

In other words, for the countries capable of carrying out a HEMP attack, the principles of nuclear deterrence and the threat of a full-scale retaliatory strike continue to hold and govern, just as they did during the most tension-filled days of the Cold War.

Rogue Actors

One scenario that has been widely put forth is that the EMP threat emanates not from a global or regional power like Russia or China but from a rogue state or a transnational terrorist group that does not possess ICBMs but will use subterfuge to accomplish its mission without leaving any fingerprints. In this scenario, the rogue state or terrorist group loads a nuclear warhead and missile launcher aboard a cargo ship or tanker and then launches the missile from just off the coast in order to get the warhead into position over the target for a HEMP strike. This scenario would involve either a short-range ballistic missile to achieve a localized metropolitan strike or a longer-range (but not intercontinental) ballistic missile to reach the necessary position over the Eastern or Western seaboard or the Midwest to achieve a key coastline or continental strike.

When we consider this scenario, we must first acknowledge that it faces the same obstacles as any other nuclear weapon employed in a terrorist attack. It is unlikely that a terrorist group like al Qaeda or Hezbollah can develop its own nuclear weapons program. It is also highly unlikely that a nation that has devoted significant effort and treasure to develop a nuclear weapon would entrust such a weapon to an outside organization. Any use of a nuclear weapon would be vigorously investigated and the nation that produced the weapon would be identified and would pay a heavy price for such an attack (there has been a large investment in the last decade in nuclear forensics). Lastly, as noted above, a nuclear weapon is seen as a deterrent by countries such as North Korea or Iran, which seek such weapons to protect themselves from invasion, not to use them offensively. While a group like al Qaeda would likely use a nuclear device if it could obtain one, we doubt that other groups such as Hezbollah would. Hezbollah has a known base of operations in Lebanon that could be hit in a counterstrike and would therefore be less willing to risk an attack that could be traced back to it.

Also, such a scenario would require not a crude nuclear device but a sophisticated nuclear warhead capable of being mated with a ballistic missile. There are considerable technical barriers that separate a crude nuclear device from a sophisticated nuclear warhead. The engineering expertise required to construct such a warhead is far greater than that required to construct a crude device. A warhead must be far more compact than a primitive device. It must also have a trigger mechanism and electronics and physics packages capable of withstanding the force of an ICBM launch, the journey into the cold vacuum of space and the heat and force of re-entering the atmosphere — and still function as designed. Designing a functional warhead takes considerable advances in several fields of science, including physics, electronics, engineering, metallurgy and explosives technology, and overseeing it all must be a high-end quality assurance capability. Because of this, it is our estimation that it would be far simpler for a terrorist group looking to conduct a nuclear attack to do so using a crude device than it would be using a sophisticated warhead — although we assess the risk of any non-state actor obtaining a nuclear capability of any kind, crude or sophisticated, as extraordinarily unlikely.

But even if a terrorist organization were somehow able to obtain a functional warhead and compatible fissile core, the challenges of mating the warhead to a missile it was not designed for and then getting it to launch and detonate properly would be far more daunting than it would appear at first glance. Additionally, the process of fueling a liquid-fueled ballistic missile at sea and then launching it from a ship using an improvised launcher would also be very challenging. (North Korea, Iran and Pakistan all rely heavily on Scud technology, which uses volatile, corrosive and toxic fuels.)

Such a scenario is challenging enough, even before the uncertainty of achieving the desired HEMP effect is taken into account. This is just the kind of complexity and uncertainty that well-trained terrorist operatives seek to avoid in an operation. Besides, a ground-level nuclear detonation in a city such as New York or Washington would be more likely to cause the type of terror, death and physical destruction that is sought in a terrorist attack than could be achieved by generally non-lethal EMP.

Make no mistake: EMP is real. Modern civilization depends heavily on electronics and the electrical grid for a wide range of vital functions, and this is truer in the United States than in most other countries. Because of this, a HEMP attack or a substantial geomagnetic storm could have a dramatic impact on modern life in the affected area. However, as we’ve discussed, the EMP threat has been around for more than half a century and there are a number of technical and practical variables that make a HEMP attack using a nuclear warhead highly unlikely.

When considering the EMP threat, it is important to recognize that it exists amid a myriad other threats, including related threats such as nuclear warfare and targeted, small-scale HPM attacks. They also include threats posed by conventional warfare and conventional weapons such as man-portable air-defense systems, terrorism, cyberwarfare attacks against critical infrastructure, chemical and biological attacks — even natural disasters such as earthquakes, hurricanes, floods and tsunamis.

The world is a dangerous place, full of potential threats. Some things are more likely to occur than others, and there is only a limited amount of funding to monitor, harden against, and try to prevent, prepare for and manage them all. When one attempts to defend against everything, the practical result is that one defends against nothing. Clear-sighted, well-grounded and rational prioritization of threats is essential to the effective defense of the homeland.

Hardening national infrastructure against EMP and HPM is undoubtedly important, and there are very real weaknesses and critical vulnerabilities in America’s critical infrastructure — not to mention civil society. But each dollar spent on these efforts must be balanced against a dollar not spent on, for example, port security, which we believe is a far more likely and far more consequential vector for nuclear attack by a rogue state or non-state actor.

Reprinting or republication of this report on websites is authorized by prominently displaying the following sentence, including the hyperlink to STRATFOR, at the beginning or end of the report.

Gauging the Threat of an Electromagnetic Pulse (EMP) Attack is republished with permission of STRATFOR.”

Simply copy and paste this code:

Domestic Equity Mutual Funds See Outflows For The 18’th Consecutive Week, ETF’s Have Small Outflows

Posted By on September 8, 2010

Here is the key to this….In tracking mutual fund redemptions, net cash liquidity is now down to just 3.5% of assets.  This is very negative data for the stock market.

Domestic equity mutual funds saw $7.5 billion in outflows, it’s the biggest one week outflow since the $13.4 billion redeemed in the week of the Flash Crash. It’s the 18th consecutive week of outflows.

Year to Date the total pulled out is a whopping $62 billion, with both inflows and the market having peaked at the same time in April. In tracking mutual fund redemptions, net cash liquidity is now down to just 3.5% of assets.

ETF’s Have Small Net Outflows For August:

August 2010 net cash outflows from all ETFs/ETNs totaled approximately $1.9 billion, with year-to-date net cash inflows totaling $47.6 billion. Total Global/Int’l Equities led all product categories with over $4.5 billion in net cash inflows. Total U.S. Equities had net cash outflows of over $10.9 billion for the month of August 2010.

This and more data is included in the full NSX August 2010 Month-End ETF/ETN Data Report released by the Exchange, which has become a key industry source for ETF/ETN data. These Data Reports are published following the end of each calendar month.

To view the full reports go to: http://www.nsx.com/content/market-data. NSX also publishes a product-by-product breakdown of the 1046 products on which the data is based. The complete list can be accessed at: http://www.nsx.com/content/etf-product-list.

Commercial Loan Delinquencies Sets New Record At 8.92%

Posted By on September 8, 2010

After two months of moderated growth in delinquent loans backing commercial mortgage-backed securities (CMBS), the delinquency rate in August increased 21 basis points to 8.92%, according to the analytics firm Trepp.

It’s an increase from the 8.71% measured in July and another new record. The August delinquency rate is more than double the 4.03% rate a year ago. Since the beginning of 2010, the delinquency rate has increased more than 200 bps.

“The August numbers may argue that the commercial real estate crisis is far from over,” according to the Trepp report.

While the amount of modifications on CMBS loans in 2010 has already passed the combined total of the last two years, the amount of serious-delinquent loans increased 20 bps in August to 8.15%. That includes loans in 60-plus day delinquency, foreclosure, REO or other nonperforming pools. A year ago, the rate of loans in serious delinquency stood at 3.08%.

We’re On A Long Windy Down Hill Road To Nowhere

Posted By on September 8, 2010

Between 1974 and 1982 nominal stock prices drifted slowly higher as corporate earnings picked up; thereby compressing valuations and ending the bear-market. But from the current look of things we are a ways from that outcome. 
   

Secular Bear Market 1966-1982

Castro Says Cuban Model Doesn’t Work Anymore!

Posted By on September 8, 2010

Sounds like a hybred communist capitalist system is coming to Cuba soon.  Maybe they will look to the Chinnese model for guidence!

HAVANA    Fidel Castro told a visiting American journalist that Cuba’s communist economic model doesn’t work, in a rare comment on domestic affairs.

Jeffrey Goldberg, a national correspondent for The Atlantic magazine, asked if Cuba’s economic system was still worth exporting to other countries, and Castro replied: “The Cuban model doesn’t even work for us anymore” Goldberg wrote Wednesday in a post on his Atlantic blog.

He said Castro made the comment casually over lunch following a long talk about the Middle East, and did not elaborate.

Beige Book Out….Fed Banks: ‘Widespread Signs of a Deceleration’ In Economy

Posted By on September 8, 2010

The Federal Reserve said the U.S. economy maintained its expansion while showing “widespread signs of a deceleration” in mid-July through the end of August, according to a survey by 12 regional Fed banks.

The New York Fed reported “signs of decelerating” in the district, including “further deceleration” in manufacturing. The Philadelphia region said business conditions were “mixed,” while the Richmond Fed said “signs of slowing or contracting economic activity became more prevalent.” The Atlanta region’s economy “continued to slow” and Chicago’s “moderated” in July and August, the Beige Book said.

Reports received by regional Fed banks “suggested continued growth in national economic activity during the reporting period of mid-July through the end of August, but with widespread signs of a deceleration compared with preceding periods,” today’s report said.

The report showed that manufacturing maintained its expansion while showing signs of slowing. Consumer spending “appeared to increase on balance,” though shoppers were limiting purchases of non-essential items. Home sales were “very low” or “declining” in most Fed districts following the expiration of a government tax credit.

“Demand for commercial, industrial, and retail space generally remained depressed,” the Fed said, though commercial real estate “showed signs of stabilization in some areas.”

Low interest rates have failed to spur renewed borrowing.  “Most Districts reported little or no change from existing low levels of commercial and industrial lending, as businesses remained quite cautious about expansion plans,” the Fed said, also noting that “consumer lending remained sluggish in general.”

More at: http://www.bloomberg.com/news/2010-09-08/fed-banks-saw-widespread-signs-of-deceleration-in-u-s-economic-growth.html

Student Loan Debt Now Surpasses Total Credit Card Debt

Posted By on September 7, 2010

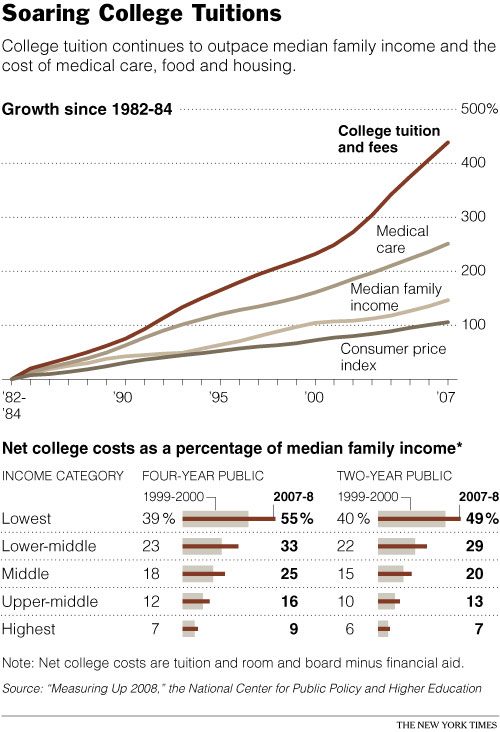
Here is another government controlled project.  These are unbelievable statistics.  Simply beyond belief!  Credit card debt peaked at $975 billion back in September of 2008 and is now down to $826 billion. Past and current students now carry a stunning $829 billion in student loan debt.   Fact:  You are not allowed to discharge student loan debt through bankruptcy. 

college tuition

Source:  New York Times

One of the more ominous statistics coming from this recession is that student loan debt has now surpassed total credit card debt in the United States.  The reason for this is based on the deep impact of the recession.  Credit card debt peak at $975 billion back in September of 2008 and is now down to $826 billion.  This is good news right?  Well the main reason for the decline has been through the rise of bankruptcies.  As this number decreased student loan debt has continued to soar and is now larger than total credit card debt.  Part of it has to do with the fact that you are not allowed to discharge student loan debt through bankruptcy.  The government is the biggest player in the student loan market but the banks are the folks dishing out the loans.  Similar to the housing bubble, when banks and government combine you usually end up with inflated prices and very wealthy bankers.  The working and middle class end up paying for the bad bets in the end with inflated prices and giant amounts of debt.

Here is the unfortunate tipping of the scales:

student loan debt

Source:  Mint

Past and current students carry a stunning $829 billion in student loan debt.  The cost of a college education has far outpaced the rate of inflation. 

annual cost college

Interesting that in 2005 when costs started skyrocketing this happened:

student loan history

 http://www.mybudget360.com/

Copyright © 2025 The Stated Truth