Posted By thestatedtruth.com on April 21, 2013
The U.S. GDP Will Be Revised Higher By $500 Billion Following Addition Of “Intangibles” To Economy
Those who have been following the US debt to GDP ratio now that the US officially does not have a debt ceiling indefinitely, may have had the occasional panic attack seeing how this country’s leverage ratio is rapidly approaching that of a Troika case study of a PIIG in complete failure. And at 107% debt/GDP no explanations are necessary. Luckily, the official gatekeepers of America’s economic growth (with decimal point precision), the Bureau of Economic Analysis have a plan on how to make the US economy, which is now growing at an abysmal 1.5% annualized pace, or about 5 times slower than US debt growing at 7.5% annually, catch up: magically make up a number out of thin air, and add it to the total. And it literally is out of thin air: according to the FT the addition will constitute of a one-time addition of intangibles, amounting to 3% of total US GDP, or more than the size of Belgium at $500 billion, to the US economy.
From FT (Financial Times):
The US economy will officially become 3 per cent bigger in July as part of a shake-up that will see government statistics take into account 21st century components such as film royalties and spending on research and development.
Billions of dollars of intangible assets will enter the gross domestic product of the world’s largest economy in a revision aimed at capturing the changing nature of US output.
Brent Moulton, who manages the national accounts at the Bureau of Economic Analysis, told the Financial Times that the update was the biggest since computer software was added to the accounts in 1999.
“We are carrying these major changes all the way back in time – which for us means to 1929 – so we are essentially rewriting economic history,” said Mr Moulton.
What exactly will constitute GDP growth going forward? In a word, intangibles: films, books, magazines and iTunes songs.
“We’re capitalising research and development and also this category referred to as entertainment, literary and artistic originals, which would be things like motion picture originals, long-lasting television programmes, books and sound recordings,” said Mr Moulton.
At present, R&D counts as a cost of doing business, so the final output of Apple iPads is included in GDP but the research done to create them is not. R&D will now count as an investment, adding a bit more than 2 per cent to the measured size of the economy.
Nothing like adding intangibles in the fluid, ever-changing definition of what constitutes an economy.
Naturally, the only reason for this artificial “boost” to the US economy which apparently can be any old arbitrary number agreed upon by a few accountants, and which always goes up post revision, never down, is to make US debt/GDP under 100% once again, if only very briefly. Surely a few months later something else can be “added” to GDP making the US economy appear better than it is once more.
Finally, all of the above is a distraction for idiots.
As most people should know by know (this logically excludes economists), the only factor leading to economic “growth” is the expansion of liabilities of the financial system, whereby new credit (in a healthy environment, not one centrally-planned by several Princeton real-world rejects, where the central bank is forced to create all credit expansion with money that never leaves the banks and the capital markets closed loop) creates new money, creates demand for products and services, and circulates in the economy.
This can be seen in the chart below which shows the nearly perfect correlation between total bank liabilities in the US, as per the Fed’s Flow Of Funds report, and total US GDP.

Bottom line: the BEA can capitalize air consumption if it thinks it will make US GDP soar, but unless new credit and bank liabilities are created not due to forced supply but demand, and unless the private financial sector is finally willing to start lending money (which for the entire duration of QE it has not) US growth will stall and then proceed to decline.
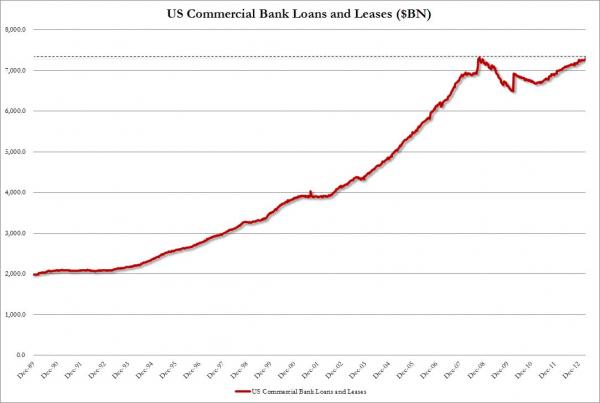
Case in point: total US commerical bank loans are still lower than they were the day Lehman filed.

In other words, all the GDP “growth” since the Lehman failure has come on the back of money “created” by the Fed.
And there are still those who think the Fed will ever unwind…
www.zerohedge.com
Category: Charts and Graphs, Commentary, Economy, National News, Uncategorized, Wall Street |
23 Comments »
Tags: Economy, gdp, Intangibles, Revised, Rigged, System, Wall Street, Whopper


